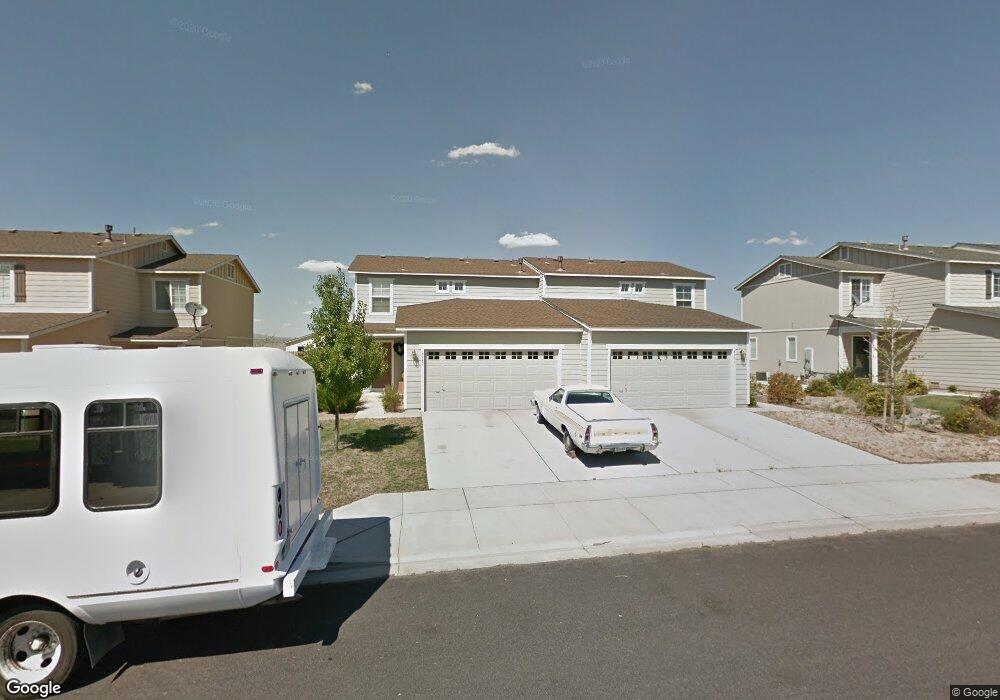
8967 Red Baron Blvd Unit NV Reno, NV 89506
Stead NeighborhoodEstimated Value: $385,725 - $2,219,000
3
Beds
3
Baths
1,350
Sq Ft
$635/Sq Ft
Est. Value
About This Home
This home is located at 8967 Red Baron Blvd Unit NV, Reno, NV 89506 and is currently estimated at $857,181, approximately $634 per square foot. 8967 Red Baron Blvd Unit NV is a home located in Washoe County with nearby schools including Stokesdale Elementary School, Silver Lake Elementary School, and Glenn C. Marlow Elementary School.
Ownership History
Date
Name
Owned For
Owner Type
Purchase Details
Closed on
Jan 24, 2022
Sold by
Samantha Mcgrath
Bought by
Perez Geronimo
Current Estimated Value
Home Financials for this Owner
Home Financials are based on the most recent Mortgage that was taken out on this home.
Original Mortgage
$356,250
Outstanding Balance
$327,472
Interest Rate
3.22%
Mortgage Type
New Conventional
Estimated Equity
$529,709
Purchase Details
Closed on
Nov 9, 2005
Sold by
Centex Homes
Bought by
Mcgrath Samantha and Novak Peggy E
Home Financials for this Owner
Home Financials are based on the most recent Mortgage that was taken out on this home.
Original Mortgage
$247,142
Interest Rate
5.9%
Mortgage Type
FHA
Create a Home Valuation Report for This Property
The Home Valuation Report is an in-depth analysis detailing your home's value as well as a comparison with similar homes in the area
Home Values in the Area
Average Home Value in this Area
Purchase History
| Date | Buyer | Sale Price | Title Company |
|---|---|---|---|
| Perez Geronimo | $375,000 | Stewart Title | |
| Mcgrath Samantha | $251,500 | Commerce Title Company |
Source: Public Records
Mortgage History
| Date | Status | Borrower | Loan Amount |
|---|---|---|---|
| Open | Perez Geronimo | $356,250 | |
| Previous Owner | Mcgrath Samantha | $247,142 |
Source: Public Records
Tax History Compared to Growth
Tax History
| Year | Tax Paid | Tax Assessment Tax Assessment Total Assessment is a certain percentage of the fair market value that is determined by local assessors to be the total taxable value of land and additions on the property. | Land | Improvement |
|---|---|---|---|---|
| 2025 | $1,515 | $73,661 | $25,270 | $48,391 |
| 2024 | $1,515 | $70,220 | $21,812 | $48,409 |
| 2023 | $1,403 | $66,219 | $23,641 | $42,579 |
| 2022 | $1,362 | $56,322 | $19,518 | $36,804 |
| 2021 | $1,263 | $52,093 | $15,262 | $36,831 |
| 2020 | $1,189 | $52,635 | $15,628 | $37,007 |
| 2019 | $1,129 | $51,114 | $15,096 | $36,018 |
| 2018 | $1,078 | $45,332 | $10,108 | $35,224 |
| 2017 | $1,034 | $44,619 | $9,676 | $34,943 |
| 2016 | $1,008 | $43,682 | $8,279 | $35,403 |
| 2015 | $1,009 | $43,497 | $7,481 | $36,016 |
| 2014 | $1,721 | $32,420 | $4,888 | $27,532 |
| 2013 | -- | $25,823 | $3,890 | $21,933 |
Source: Public Records
Map
Nearby Homes
- 8660 Sunrise Mist Ct
- 8678 Strutter Way
- 8602 Strutter Way
- 7456 Creekland Dr
- 7497 Hebrides Ct
- 7447 Findhorn Dr
- 7462 Findhorn Dr
- 7663 Crystal Shores Dr
- 8486 Piper Place
- 7085 Indigo Cir
- 8410 Red Baron Blvd
- 11642 Green Mountain St
- 12123 Andes St
- 8419 Sopwith Blvd
- 6995 Peppermint Dr
- 12360 Rocky Mountain St
- 12190 Rocky Mountain St
- 6769 Peppermint Ct
- 6521 Flower St
- 11 Panamint Dr
- 8967 Red Baron Blvd
- 8971 Red Baron Blvd
- 8963 Red Baron Blvd
- 8975 Red Baron Blvd
- 8979 Red Baron Blvd
- 8955 Red Baron Blvd
- 8833 Silverkist Dr
- 8968 Red Baron Blvd
- 8829 Silverkist Dr
- 8964 Red Baron Blvd
- 8825 Silverkist Dr
- 8983 Red Baron Blvd
- 8951 Red Baron Blvd
- 8837 Silverkist Dr
- 8960 Red Baron Blvd
- 8987 Red Baron Blvd
- 8821 Silverkist Dr
- 8690 Crimson Sky Ct
- 8947 Red Baron Blvd
- 8956 Red Baron Blvd