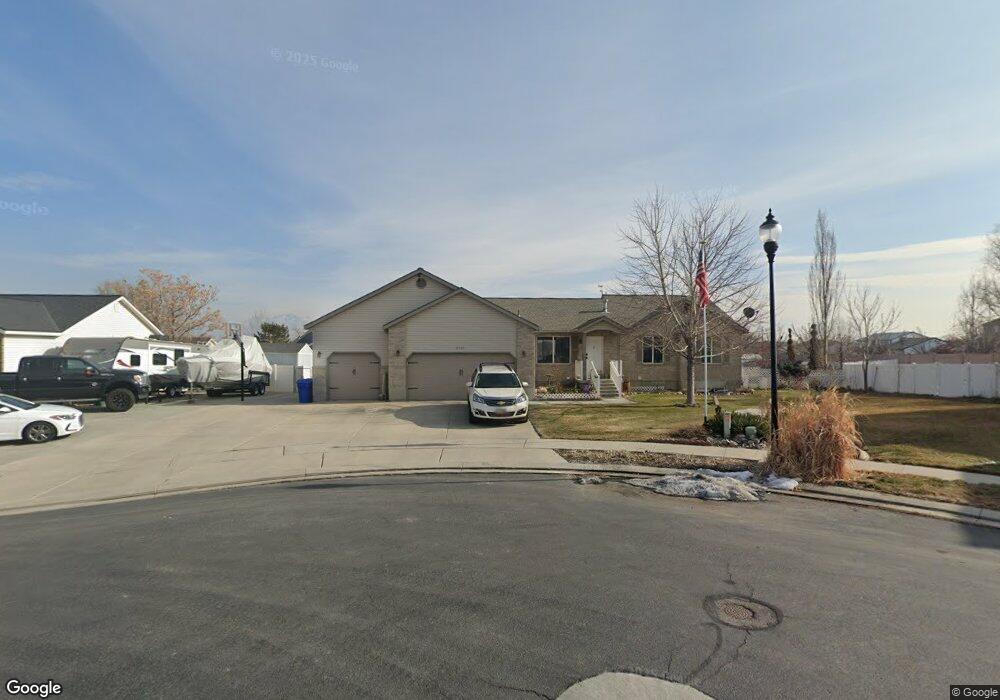
8969 Yellow Pine St West Jordan, UT 84088
Jordan Oaks NeighborhoodEstimated Value: $611,000 - $638,000
5
Beds
3
Baths
2,794
Sq Ft
$225/Sq Ft
Est. Value
About This Home
This home is located at 8969 Yellow Pine St, West Jordan, UT 84088 and is currently estimated at $627,279, approximately $224 per square foot. 8969 Yellow Pine St is a home located in Salt Lake County with nearby schools including Jordan Hills Elementary School, West Hills Middle School, and Copper Hills High School.
Ownership History
Date
Name
Owned For
Owner Type
Purchase Details
Closed on
Sep 16, 2012
Sold by
Jensen Jack
Bought by
Jensen Karri Jo and Jensen Jack
Current Estimated Value
Purchase Details
Closed on
Jun 30, 2011
Sold by
Jensen Harvey R and Jensen Mary Lue
Bought by
Jensen Jack
Purchase Details
Closed on
Oct 25, 2004
Sold by
Jensen Harvey R
Bought by
Jensen Harvey R and Jensen Mary Lue
Purchase Details
Closed on
May 12, 2004
Sold by
Jensen Mary Lue
Bought by
Jensen Harvey R
Home Financials for this Owner
Home Financials are based on the most recent Mortgage that was taken out on this home.
Original Mortgage
$167,712
Outstanding Balance
$78,633
Interest Rate
5.5%
Mortgage Type
FHA
Estimated Equity
$548,646
Purchase Details
Closed on
Sep 24, 1999
Sold by
Jensen Harvey
Bought by
Jensen Harvey and Jensen Mary Lue
Home Financials for this Owner
Home Financials are based on the most recent Mortgage that was taken out on this home.
Original Mortgage
$137,650
Interest Rate
10.87%
Create a Home Valuation Report for This Property
The Home Valuation Report is an in-depth analysis detailing your home's value as well as a comparison with similar homes in the area
Home Values in the Area
Average Home Value in this Area
Purchase History
| Date | Buyer | Sale Price | Title Company |
|---|---|---|---|
| Jensen Karri Jo | -- | None Available | |
| Jensen Jack | -- | Premium Title & Escrow | |
| Jensen Harvey R | -- | -- | |
| Jensen Harvey R | -- | -- | |
| Jensen Harvey | -- | Merrill Title | |
| Jensen Harvey | -- | Merrill Title |
Source: Public Records
Mortgage History
| Date | Status | Borrower | Loan Amount |
|---|---|---|---|
| Open | Jensen Harvey R | $167,712 | |
| Closed | Jensen Harvey | $137,650 |
Source: Public Records
Tax History Compared to Growth
Tax History
| Year | Tax Paid | Tax Assessment Tax Assessment Total Assessment is a certain percentage of the fair market value that is determined by local assessors to be the total taxable value of land and additions on the property. | Land | Improvement |
|---|---|---|---|---|
| 2025 | $3,051 | $594,100 | $163,000 | $431,100 |
| 2024 | $3,051 | $587,100 | $161,400 | $425,700 |
| 2023 | $3,073 | $557,200 | $152,300 | $404,900 |
| 2022 | $2,993 | $533,900 | $149,300 | $384,600 |
| 2021 | $2,455 | $398,700 | $116,000 | $282,700 |
| 2020 | $2,289 | $348,800 | $116,000 | $232,800 |
| 2019 | $2,259 | $337,600 | $109,500 | $228,100 |
| 2018 | $0 | $317,000 | $109,500 | $207,500 |
| 2017 | $1,916 | $282,800 | $109,500 | $173,300 |
| 2016 | $1,828 | $253,400 | $109,500 | $143,900 |
| 2015 | $1,911 | $258,300 | $115,800 | $142,500 |
| 2014 | $1,764 | $234,800 | $106,400 | $128,400 |
Source: Public Records
Map
Nearby Homes
- 4624 Pine Crossing Dr
- 8941 S Sun Leaf Dr
- 4707 W Granada Hills Ct
- 9353 S 4460 W
- 4904 Wild Acres Dr
- 4887 W 8620 S
- 4565 Lennox Dr
- 5098 Cherry Laurel Ln
- 9332 S Wild Clover Ln
- 9375 S Laurel Ridge Cir
- 8359 Etude Dr
- 3931 W Dansere Cir
- 8577 Autumn Gold Cir
- 4424 W Skye Dr
- 3888 W 8700 S
- 7903 Mckenzie Ln
- 7886 Mckenzie Ln
- 8400 S 4000 W Unit 134
- 9118 S Wisteria Way
- 3750 W Bingham Creek Dr
- 4541 Balsam Pine Dr
- 8962 Pinenut Cir
- 8962 S Pinenut Cir
- 8959 Yellow Pine St
- 8959 S Yellow Pine St
- 8972 Pinenut Cir
- 4555 W Balsam Pine Dr
- 4555 Balsam Pine Dr
- 8948 Pinenut Cir
- 8948 S Pinenut Cir
- 4558 W Balsam Pine Dr
- 4558 Balsam Pine Dr
- 8945 Yellow Pine St
- 8971 Pinenut Cir
- 4569 Balsam Pine Dr
- 8944 Yellow Pine St
- 4512 Barrington Dr
- 4500 Barrington Dr
- 4515 Barrington Dr
- 4498 Barrington Dr