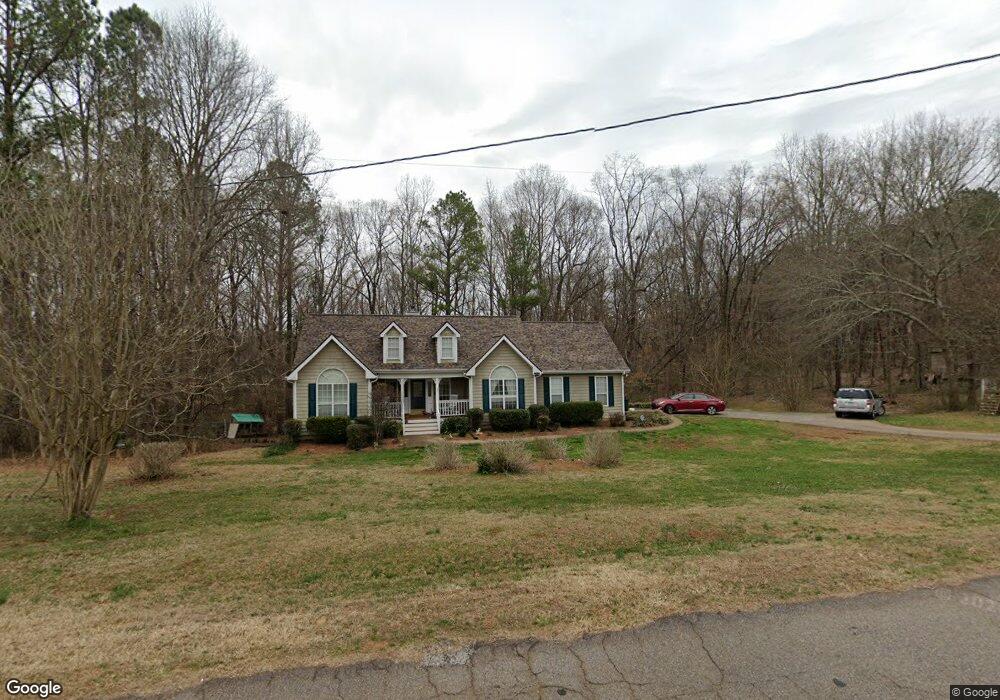
897 Moon Bridge Rd Winder, GA 30680
Estimated Value: $327,775 - $419,000
3
Beds
2
Baths
1,634
Sq Ft
$222/Sq Ft
Est. Value
About This Home
This home is located at 897 Moon Bridge Rd, Winder, GA 30680 and is currently estimated at $362,944, approximately $222 per square foot. 897 Moon Bridge Rd is a home located in Barrow County with nearby schools including Holsenbeck Elementary School, Bear Creek Middle School, and Winder-Barrow High School.
Ownership History
Date
Name
Owned For
Owner Type
Purchase Details
Closed on
Sep 15, 2011
Sold by
Crask Melvin Ray
Bought by
Pratt Brian A and Pratt Beth L
Current Estimated Value
Home Financials for this Owner
Home Financials are based on the most recent Mortgage that was taken out on this home.
Original Mortgage
$141,223
Outstanding Balance
$93,128
Interest Rate
3.5%
Mortgage Type
FHA
Estimated Equity
$269,816
Purchase Details
Closed on
Mar 26, 2004
Sold by
Crask Melvin R
Bought by
Crask Melvin R And
Purchase Details
Closed on
Nov 10, 1998
Sold by
Jackson Michael Glen and Jackson Lori
Bought by
Crask Melvin R
Home Financials for this Owner
Home Financials are based on the most recent Mortgage that was taken out on this home.
Original Mortgage
$134,800
Interest Rate
6.58%
Mortgage Type
New Conventional
Create a Home Valuation Report for This Property
The Home Valuation Report is an in-depth analysis detailing your home's value as well as a comparison with similar homes in the area
Home Values in the Area
Average Home Value in this Area
Purchase History
| Date | Buyer | Sale Price | Title Company |
|---|---|---|---|
| Pratt Brian A | $144,900 | -- | |
| Crask Melvin R And | -- | -- | |
| Crask Melvin R | $141,900 | -- |
Source: Public Records
Mortgage History
| Date | Status | Borrower | Loan Amount |
|---|---|---|---|
| Open | Pratt Brian A | $141,223 | |
| Previous Owner | Crask Melvin R | $134,800 |
Source: Public Records
Tax History Compared to Growth
Tax History
| Year | Tax Paid | Tax Assessment Tax Assessment Total Assessment is a certain percentage of the fair market value that is determined by local assessors to be the total taxable value of land and additions on the property. | Land | Improvement |
|---|---|---|---|---|
| 2024 | $2,400 | $100,309 | $18,000 | $82,309 |
| 2023 | $1,977 | $100,309 | $18,000 | $82,309 |
| 2022 | $1,941 | $70,888 | $18,000 | $52,888 |
| 2021 | $1,796 | $62,514 | $14,000 | $48,514 |
| 2020 | $1,548 | $54,140 | $10,000 | $44,140 |
| 2019 | $1,574 | $54,140 | $10,000 | $44,140 |
| 2018 | $1,551 | $54,140 | $10,000 | $44,140 |
| 2017 | $1,411 | $48,470 | $10,000 | $38,470 |
| 2016 | $1,305 | $47,013 | $10,000 | $37,013 |
| 2015 | $1,338 | $47,906 | $10,000 | $37,906 |
| 2014 | $1,209 | $43,252 | $4,900 | $38,352 |
| 2013 | -- | $40,874 | $4,900 | $35,974 |
Source: Public Records
Map
Nearby Homes
- 0 Moon Bridge Rd Unit 10632936
- 809 Moon Bridge Rd
- 198 Celestial Run
- 184 Celestial Run
- 152 Blue Rider Trail
- The Mulberry Plan at Steeplechase
- The Milton Plan at Steeplechase
- The Brookdale Plan at Steeplechase
- Kingston Plan at Steeplechase
- 722 Moonlite Trace
- 752 Moon Bridge Rd
- 204 Races Rd
- 180 Races Rd
- 624 Skyland Dr
- 855 Crystal Meadow Dr
- 826 Crystal Meadow Dr
- 5896 Woodland Park Ct
- 131 Canix Ln
- 5883 Woodland Park Ct
- 3844 Cheyenne Ln
- 905 Moon Bridge Rd
- 916 Moon Bridge Rd
- 853 Moon Bridge Rd
- 884 Moon Bridge Rd
- 914 Moon Bridge Rd
- 0 Moon Bridge Rd Unit 7057523
- 872 Moon Bridge Rd
- 845 Moon Bridge Rd Unit 1
- 845 Moon Bridge Rd
- 866 Moon Bridge Rd
- 877 Moon Bridge Rd
- 429 Moons Bridge Rd
- 846 Moon Bridge Rd
- 846 Moon Bridge Rd
- 503 Moons Bridge Rd
- 441 Moons Bridge Rd
- 278 Dogwood Ln
- 274 Dogwood Ln
- 425 Moons Bridge Rd
- 842 Moon Bridge Rd