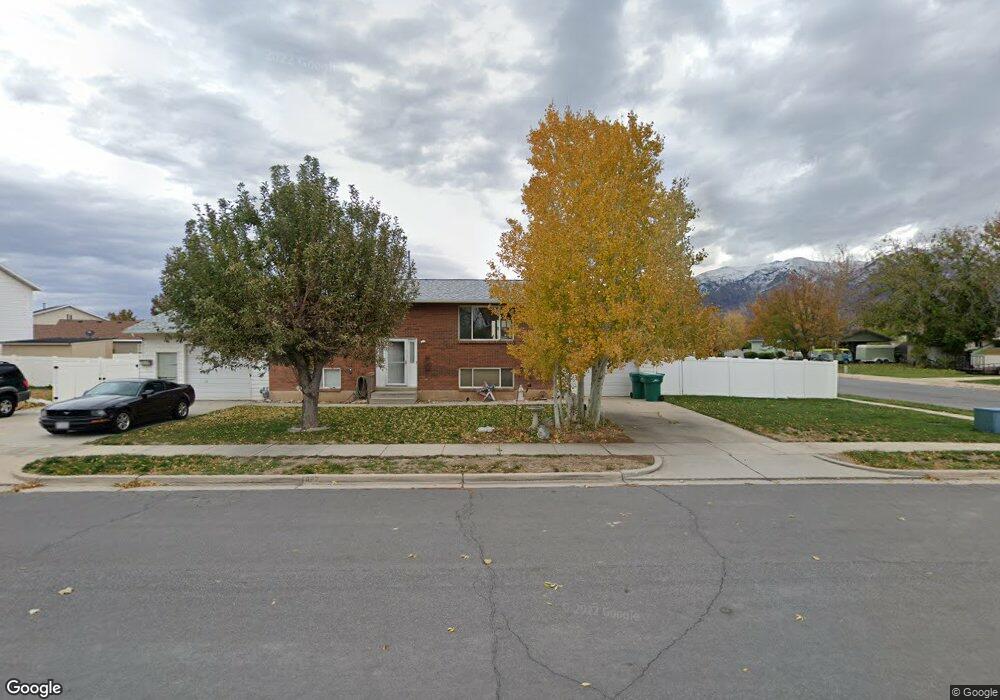
897 S 50 E Layton, UT 84041
Estimated Value: $435,407 - $464,000
4
Beds
2
Baths
980
Sq Ft
$454/Sq Ft
Est. Value
About This Home
This home is located at 897 S 50 E, Layton, UT 84041 and is currently estimated at $445,352, approximately $454 per square foot. 897 S 50 E is a home located in Davis County with nearby schools including Layton Elementary School, Fairfield Junior High School, and Davis High School.
Ownership History
Date
Name
Owned For
Owner Type
Purchase Details
Closed on
Feb 4, 2026
Sold by
Willis John Steven and Woods Carla M
Bought by
Willis & Woods Llc
Current Estimated Value
Purchase Details
Closed on
Feb 9, 2021
Sold by
Willis John Steven
Bought by
Willis John Steven and Woods Carla M
Purchase Details
Closed on
Sep 27, 1999
Sold by
Larberg Nancy L
Bought by
Willis John Steven
Home Financials for this Owner
Home Financials are based on the most recent Mortgage that was taken out on this home.
Original Mortgage
$109,350
Interest Rate
8.09%
Purchase Details
Closed on
May 7, 1999
Sold by
Bartholomew Larry
Bought by
Larberg Nancy L
Purchase Details
Closed on
Apr 19, 1999
Sold by
Larberg John H
Bought by
Bartholomew Larry
Purchase Details
Closed on
May 22, 1997
Sold by
Larberg John Henry and Larberg Nancy Lee
Bought by
Larberg John H and Larberg Nancy L
Home Financials for this Owner
Home Financials are based on the most recent Mortgage that was taken out on this home.
Original Mortgage
$65,000
Interest Rate
8.13%
Create a Home Valuation Report for This Property
The Home Valuation Report is an in-depth analysis detailing your home's value as well as a comparison with similar homes in the area
Home Values in the Area
Average Home Value in this Area
Purchase History
| Date | Buyer | Sale Price | Title Company |
|---|---|---|---|
| Willis & Woods Llc | -- | None Listed On Document | |
| Willis John Steven | -- | None Available | |
| Willis John Steven | -- | Founders Title Co | |
| Larberg Nancy L | -- | -- | |
| Bartholomew Larry | -- | Founders Title Co | |
| Larberg John H | -- | Bonneville Title Company Inc |
Source: Public Records
Mortgage History
| Date | Status | Borrower | Loan Amount |
|---|---|---|---|
| Previous Owner | Willis John Steven | $109,350 | |
| Previous Owner | Larberg John H | $65,000 |
Source: Public Records
Tax History
| Year | Tax Paid | Tax Assessment Tax Assessment Total Assessment is a certain percentage of the fair market value that is determined by local assessors to be the total taxable value of land and additions on the property. | Land | Improvement |
|---|---|---|---|---|
| 2025 | $2,326 | $244,200 | $108,465 | $135,735 |
| 2024 | $2,242 | $237,050 | $119,331 | $117,719 |
| 2023 | $2,007 | $374,000 | $119,386 | $254,614 |
| 2022 | $2,174 | $220,000 | $73,780 | $146,220 |
| 2021 | $1,948 | $294,000 | $110,688 | $183,312 |
| 2020 | $1,761 | $255,000 | $93,341 | $161,659 |
| 2019 | $1,692 | $240,000 | $95,348 | $144,652 |
| 2018 | $1,545 | $220,000 | $83,674 | $136,326 |
| 2016 | $1,352 | $99,275 | $33,087 | $66,188 |
| 2015 | $1,291 | $90,035 | $33,087 | $56,948 |
| 2014 | $1,347 | $96,033 | $33,087 | $62,946 |
| 2013 | -- | $86,628 | $18,612 | $68,016 |
Source: Public Records
Map
Nearby Homes
- 80 E 850 S
- 799 S 125 E
- 949 S 225 E
- 948 S 250 E
- 753 S 300 E
- 389 Morgan St
- 189 S Main St Unit 76
- 189 S Main St Unit 21
- 1460 W Pleasant View Dr Unit 7
- 1435 W Pleasant View Dr Unit 37
- 1439 W Pleasant View Dr Unit 35
- 1440 W Pleasant View Dr Unit 3
- 706 S 600 E
- 811 S Main St
- 617 E 405 S
- 623 E Clearwater Dr Unit 15
- 765 W Farming Way
- 339 W 25 N Unit 6
- 905 S Main St Unit G
- 355 W Gentile St
Your Personal Tour Guide
Ask me questions while you tour the home.