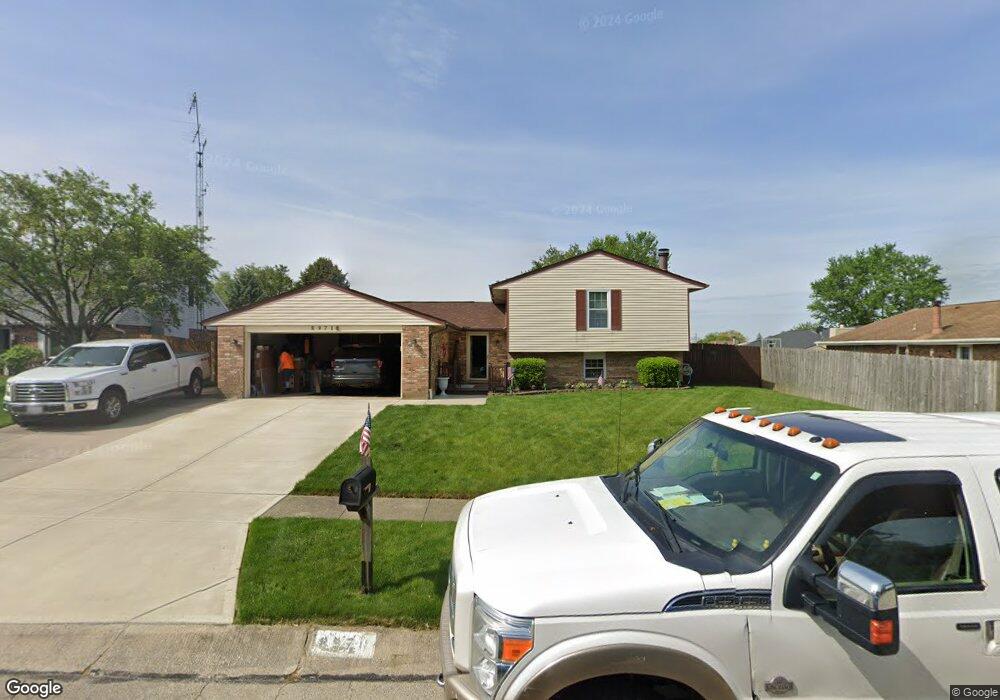
8971 Swinging Gate Dr Dayton, OH 45424
Estimated Value: $267,000 - $308,000
4
Beds
3
Baths
1,506
Sq Ft
$188/Sq Ft
Est. Value
About This Home
This home is located at 8971 Swinging Gate Dr, Dayton, OH 45424 and is currently estimated at $282,565, approximately $187 per square foot. 8971 Swinging Gate Dr is a home located in Montgomery County with nearby schools including Wayne High School and Huber Heights Christian Academy.
Ownership History
Date
Name
Owned For
Owner Type
Purchase Details
Closed on
Jul 8, 2006
Sold by
Shelton Willie H and Shelton Stacey L
Bought by
Snyder Glen Allen and Snyder Barbara Ann
Current Estimated Value
Home Financials for this Owner
Home Financials are based on the most recent Mortgage that was taken out on this home.
Original Mortgage
$126,000
Interest Rate
6.58%
Mortgage Type
Purchase Money Mortgage
Purchase Details
Closed on
Apr 12, 2001
Sold by
Cheryl Dixon and Dixon Jeffrey
Bought by
Shelton Willie H and Shelton Stacey L
Home Financials for this Owner
Home Financials are based on the most recent Mortgage that was taken out on this home.
Original Mortgage
$133,900
Interest Rate
7.05%
Mortgage Type
VA
Purchase Details
Closed on
Apr 30, 1996
Sold by
Miller Curtis B
Bought by
Dixon Cheryl and Dixon Jeffrey
Purchase Details
Closed on
Mar 24, 1995
Sold by
Ford Consumer Finance Company Inc
Bought by
Miller Curtis B
Create a Home Valuation Report for This Property
The Home Valuation Report is an in-depth analysis detailing your home's value as well as a comparison with similar homes in the area
Home Values in the Area
Average Home Value in this Area
Purchase History
| Date | Buyer | Sale Price | Title Company |
|---|---|---|---|
| Snyder Glen Allen | $157,500 | None Available | |
| Shelton Willie H | $130,000 | First Title Agency Inc | |
| Dixon Cheryl | $121,000 | Midland Title Security Inc | |
| Miller Curtis B | -- | -- |
Source: Public Records
Mortgage History
| Date | Status | Borrower | Loan Amount |
|---|---|---|---|
| Open | Snyder Glen Allen | $31,500 | |
| Previous Owner | Snyder Glen Allen | $126,000 | |
| Previous Owner | Shelton Willie H | $133,900 |
Source: Public Records
Tax History Compared to Growth
Tax History
| Year | Tax Paid | Tax Assessment Tax Assessment Total Assessment is a certain percentage of the fair market value that is determined by local assessors to be the total taxable value of land and additions on the property. | Land | Improvement |
|---|---|---|---|---|
| 2024 | $3,930 | $76,500 | $14,910 | $61,590 |
| 2023 | $3,930 | $76,500 | $14,910 | $61,590 |
| 2022 | $3,511 | $53,850 | $10,500 | $43,350 |
| 2021 | $3,558 | $53,850 | $10,500 | $43,350 |
| 2020 | $3,561 | $53,850 | $10,500 | $43,350 |
| 2019 | $3,520 | $47,080 | $10,500 | $36,580 |
| 2018 | $3,532 | $47,080 | $10,500 | $36,580 |
| 2017 | $3,508 | $47,080 | $10,500 | $36,580 |
| 2016 | $3,481 | $45,510 | $10,500 | $35,010 |
| 2015 | $3,436 | $45,510 | $10,500 | $35,010 |
| 2014 | $3,436 | $45,510 | $10,500 | $35,010 |
| 2012 | -- | $46,070 | $10,500 | $35,570 |
Source: Public Records
Map
Nearby Homes
- 8948 Autumngate Ln
- 5901 Timbergate Trail
- 4957 Country Park Dr
- 5660 Shull Rd
- 8671 Pinegate Way
- 8041 Bushclover Dr
- 4676 Cobblestone Dr Unit 4676
- 4704 Cobblestone Dr Unit 4704
- 6117 Charlesgate Rd
- 8436 Indian Mound Dr
- 8554 Schoolgate Dr
- 8133 Bushclover Dr
- 4620 Cobblestone Dr Unit 4620
- 6089 Green Knolls Dr
- 8830 Christygate Ln
- 3109 Coneflower Dr
- 2003 Trillium Way
- 6219 Beacon Tree Ct
- 3005 Vervain Way
- 4010 Redbud Way
- 8961 Swinging Gate Dr
- 5768 Waynegate Rd
- 8930 Cherrygate Ct
- 5758 Waynegate Rd
- 8951 Swinging Gate Dr
- 8970 Swinging Gate Dr
- 8980 Swinging Gate Dr
- 5778 Waynegate Rd
- 8920 Cherrygate Ct
- 8960 Swinging Gate Dr
- 5748 Waynegate Rd
- 8941 Swinging Gate Dr
- 8921 Cherrygate Ct
- 8950 Swinging Gate Dr
- 5759 Waynegate Rd
- 5788 Waynegate Rd
- 8910 Cherrygate Ct
- 5738 Waynegate Rd
- 8869 Meadowgate Ct
- 8931 Swinging Gate Dr