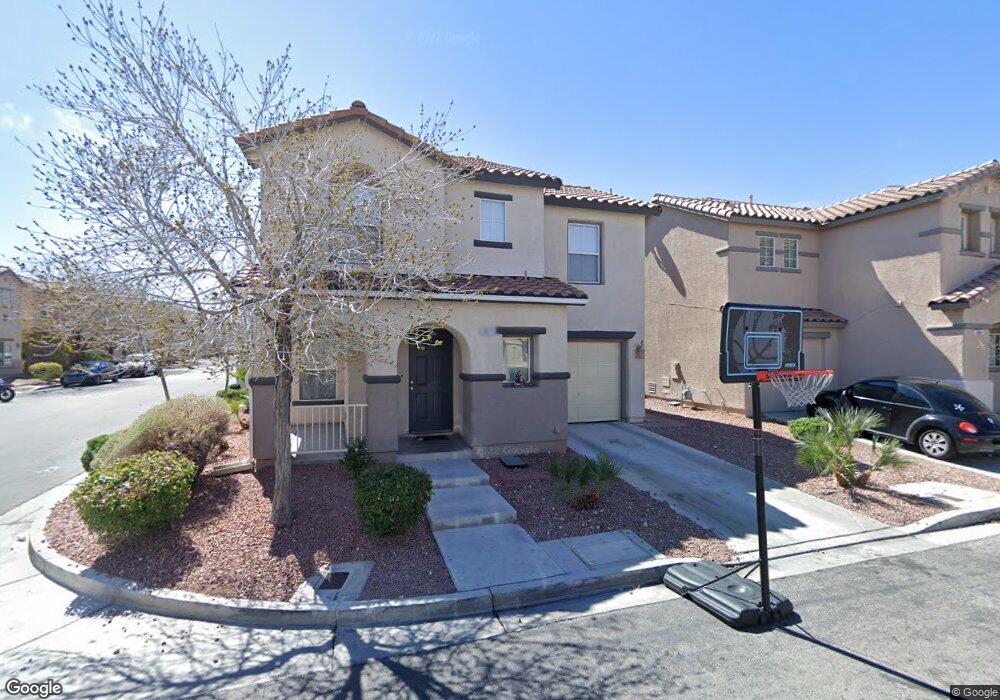
8975 Spring Peeper Ave Las Vegas, NV 89148
Estimated Value: $378,000 - $400,000
4
Beds
4
Baths
1,545
Sq Ft
$249/Sq Ft
Est. Value
About This Home
This home is located at 8975 Spring Peeper Ave, Las Vegas, NV 89148 and is currently estimated at $385,020, approximately $249 per square foot. 8975 Spring Peeper Ave is a home located in Clark County with nearby schools including Wayne N. Tanaka Elementary School, Wilbur & Theresa Faiss Middle School, and Sierra Vista High School.
Ownership History
Date
Name
Owned For
Owner Type
Purchase Details
Closed on
Feb 23, 2021
Sold by
Holland Barbara L and Holland Trust
Bought by
Wang Biao and Xu Haorong
Current Estimated Value
Purchase Details
Closed on
Nov 20, 2020
Sold by
Holland Barbara L and Holland Andrew E
Bought by
Holland Barbara L and The Holland Trust
Purchase Details
Closed on
May 31, 2006
Sold by
Weiman Elaine R
Bought by
Holland Barbara L and Holland Andrew E
Purchase Details
Closed on
Aug 22, 2003
Sold by
Kb Home Nevada Inc
Bought by
Weiman Elaine R and Holland Barbara L
Home Financials for this Owner
Home Financials are based on the most recent Mortgage that was taken out on this home.
Original Mortgage
$93,994
Interest Rate
5.6%
Mortgage Type
FHA
Create a Home Valuation Report for This Property
The Home Valuation Report is an in-depth analysis detailing your home's value as well as a comparison with similar homes in the area
Home Values in the Area
Average Home Value in this Area
Purchase History
| Date | Buyer | Sale Price | Title Company |
|---|---|---|---|
| Wang Biao | $272,000 | Ort Co Of Nevada | |
| Holland Barbara L | -- | None Available | |
| Holland Barbara L | -- | None Available | |
| Weiman Elaine R | $165,457 | First American Title Company |
Source: Public Records
Mortgage History
| Date | Status | Borrower | Loan Amount |
|---|---|---|---|
| Previous Owner | Weiman Elaine R | $93,994 |
Source: Public Records
Tax History Compared to Growth
Tax History
| Year | Tax Paid | Tax Assessment Tax Assessment Total Assessment is a certain percentage of the fair market value that is determined by local assessors to be the total taxable value of land and additions on the property. | Land | Improvement |
|---|---|---|---|---|
| 2025 | $1,518 | $89,801 | $29,750 | $60,051 |
| 2024 | $1,406 | $89,801 | $29,750 | $60,051 |
| 2023 | $1,406 | $84,683 | $28,000 | $56,683 |
| 2022 | $1,303 | $74,514 | $22,750 | $51,764 |
| 2021 | $1,206 | $69,887 | $20,650 | $49,237 |
| 2020 | $1,117 | $69,018 | $20,300 | $48,718 |
| 2019 | $1,104 | $65,449 | $17,500 | $47,949 |
| 2018 | $1,053 | $59,878 | $14,000 | $45,878 |
| 2017 | $1,721 | $58,675 | $12,250 | $46,425 |
| 2016 | $998 | $51,779 | $10,150 | $41,629 |
| 2015 | $995 | $48,114 | $7,000 | $41,114 |
| 2014 | $964 | $31,901 | $4,550 | $27,351 |
Source: Public Records
Map
Nearby Homes
- 8982 Leaping Pad Ct
- 7245 Pine Barrens St
- 8970 Flying Frog Ave
- 9050 W Warm Springs Rd Unit 1164
- 9050 W Warm Springs Rd Unit 1092
- 9050 W Warm Springs Rd Unit 2099
- 7223 Proud Patriot St Unit 1
- 7131 S Durango Dr Unit 109
- 7131 S Durango Dr Unit 104
- 7239 Proud Patriot St
- 7064 Coventry Glenn Rd
- 7127 S Durango Dr Unit 306
- 7127 S Durango Dr Unit 303
- 7115 S Durango Dr Unit 207
- 7135 S Durango Dr Unit 306
- 7135 S Durango Dr Unit 314
- 7135 S Durango Dr Unit 304
- 7135 S Durango Dr Unit 106
- 7123 S Durango Dr Unit 204
- 7143 S Durango Dr Unit 305
- 8981 Spring Peeper Ave
- 8976 Leaping Pad Ct
- 8987 Spring Peeper Ave
- 7198 Pine Barrens St
- 8974 Spring Peeper Ave
- 8980 Spring Peeper Ave Unit 2
- 8980 Spring Peeper Ave
- 8988 Leaping Pad Ct
- 7204 Pine Barrens St
- 8966 Spring Peeper Ave
- 8986 Spring Peeper Ave
- 8993 Spring Peeper Ave
- 8958 Spring Peeper Ave
- 7210 Pine Barrens St
- 7210 Pine Barrens St
- 8992 Spring Peeper Ave
- 8994 Leaping Pad Ct
- 8973 Ornate Glade Ave
- 8979 Ornate Glade Ave
- 8977 Leaping Pad Ct