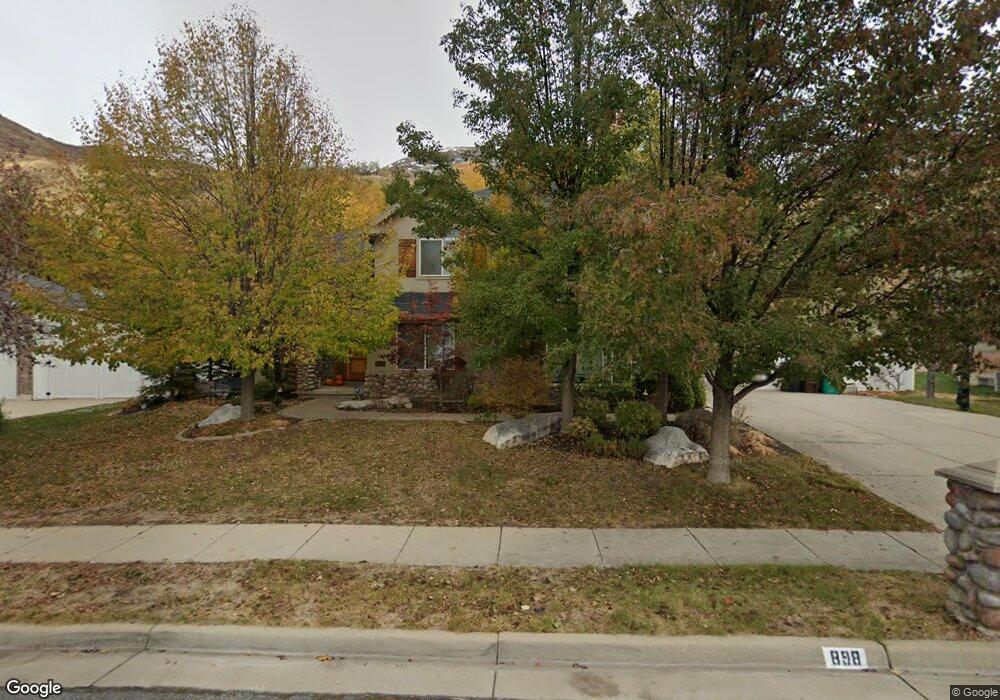
898 N 700 E Unit 114 Centerville, UT 84014
Estimated Value: $611,000 - $883,000
4
Beds
3
Baths
3,046
Sq Ft
$252/Sq Ft
Est. Value
About This Home
This home is located at 898 N 700 E Unit 114, Centerville, UT 84014 and is currently estimated at $767,577, approximately $251 per square foot. 898 N 700 E Unit 114 is a home located in Davis County with nearby schools including Centerville Elementary, Centerville Jr High, and Viewmont High School.
Ownership History
Date
Name
Owned For
Owner Type
Purchase Details
Closed on
Mar 22, 2002
Sold by
Christiansen Scott A and Christiansen Kathryn
Bought by
Horlacher H Matthew and Horlacher Kathryn N
Current Estimated Value
Home Financials for this Owner
Home Financials are based on the most recent Mortgage that was taken out on this home.
Original Mortgage
$300,000
Outstanding Balance
$123,465
Interest Rate
6.85%
Estimated Equity
$644,112
Purchase Details
Closed on
May 8, 2000
Sold by
Johnson Duane C and Johnson Vickie M
Bought by
Christiansen Scott A and Christiansen Kathryn
Home Financials for this Owner
Home Financials are based on the most recent Mortgage that was taken out on this home.
Original Mortgage
$276,000
Interest Rate
8.25%
Mortgage Type
Construction
Purchase Details
Closed on
Jan 7, 1998
Sold by
E P Rockwood Investment Lc
Bought by
Johnson Duane C and Johnson Vickie M
Create a Home Valuation Report for This Property
The Home Valuation Report is an in-depth analysis detailing your home's value as well as a comparison with similar homes in the area
Purchase History
| Date | Buyer | Sale Price | Title Company |
|---|---|---|---|
| Horlacher H Matthew | -- | Founders Title Co | |
| Christiansen Scott A | -- | Western States Title Company | |
| Johnson Duane C | -- | First American Title Co | |
| Johnson Duane C | -- | First American Title Co |
Source: Public Records
Mortgage History
| Date | Status | Borrower | Loan Amount |
|---|---|---|---|
| Open | Horlacher H Matthew | $300,000 | |
| Previous Owner | Christiansen Scott A | $276,000 | |
| Closed | Christiansen Scott A | $25,000 |
Source: Public Records
Tax History
| Year | Tax Paid | Tax Assessment Tax Assessment Total Assessment is a certain percentage of the fair market value that is determined by local assessors to be the total taxable value of land and additions on the property. | Land | Improvement |
|---|---|---|---|---|
| 2025 | $3,990 | $381,700 | $135,991 | $245,709 |
| 2024 | -- | $367,950 | $125,663 | $242,287 |
| 2023 | $3,794 | $667,000 | $201,613 | $465,387 |
| 2022 | $3,966 | $383,900 | $102,718 | $281,182 |
| 2021 | $3,515 | $530,000 | $161,953 | $368,047 |
| 2020 | $3,217 | $485,000 | $155,558 | $329,442 |
| 2019 | $3,389 | $499,000 | $147,393 | $351,607 |
| 2018 | $3,224 | $469,000 | $136,311 | $332,689 |
| 2016 | $2,769 | $223,850 | $50,668 | $173,182 |
| 2015 | $2,939 | $224,125 | $50,668 | $173,457 |
| 2014 | $3,187 | $248,663 | $50,540 | $198,123 |
| 2013 | -- | $209,051 | $49,712 | $159,339 |
Source: Public Records
Map
Nearby Homes
- 984 N 500 E
- 1290 Oakridge Dr
- 563 N 220 E
- 380 E 400 N
- 1366 Cottonwood Dr
- 252 N 400 E
- 66 Brookside Ln
- 775 Pheasantbrook Cir
- 360 E Center St
- 145 Ford Canyon Dr
- 292 W 680 N
- 281 W 650 N Unit B
- 282 W 605 N Unit A
- 282 W 605 N Unit I
- 271 Brookfield Ln
- 781 Pheasantbrook Dr
- 56 W 200 N
- 328 E 1100 S
- 16 S 200 E
- 303 W 650 N Unit I
Your Personal Tour Guide
Ask me questions while you tour the home.