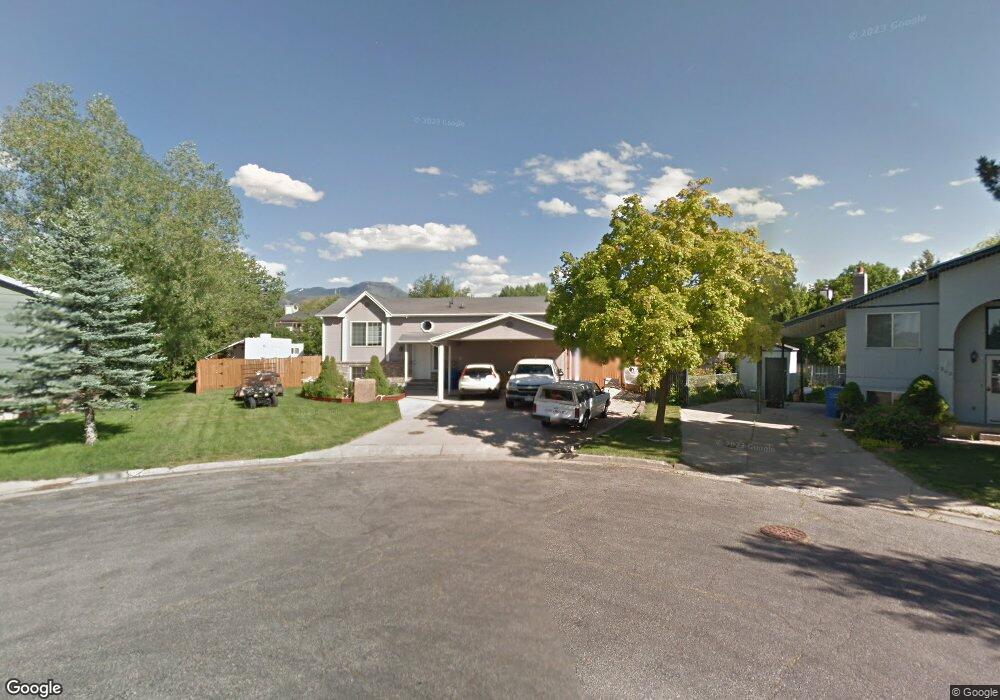
898 W 330 S Logan, UT 84321
Woodruff NeighborhoodEstimated Value: $363,000 - $390,000
Studio
--
Bath
992
Sq Ft
$380/Sq Ft
Est. Value
About This Home
This home is located at 898 W 330 S, Logan, UT 84321 and is currently estimated at $377,359, approximately $380 per square foot. 898 W 330 S is a home with nearby schools including Woodruff School, Mount Logan Middle School, and Logan High School.
Ownership History
Date
Name
Owned For
Owner Type
Purchase Details
Closed on
Dec 22, 2021
Sold by
Evans Tamra Jo and Hallmark Tamra J
Bought by
Hallmark Tamra J
Current Estimated Value
Home Financials for this Owner
Home Financials are based on the most recent Mortgage that was taken out on this home.
Original Mortgage
$60,000
Outstanding Balance
$54,972
Interest Rate
2.98%
Mortgage Type
Commercial
Estimated Equity
$322,387
Purchase Details
Closed on
Apr 3, 2001
Sold by
Webb Jennifer
Bought by
Evans Tamra Jo
Create a Home Valuation Report for This Property
The Home Valuation Report is an in-depth analysis detailing your home's value as well as a comparison with similar homes in the area
Home Values in the Area
Average Home Value in this Area
Purchase History
| Date | Buyer | Sale Price | Title Company |
|---|---|---|---|
| Hallmark Tamra J | -- | American Secure Ttl Brigham | |
| Evans Tamra Jo | -- | Northern Title Company |
Source: Public Records
Mortgage History
| Date | Status | Borrower | Loan Amount |
|---|---|---|---|
| Open | Hallmark Tamra J | $60,000 |
Source: Public Records
Tax History
| Year | Tax Paid | Tax Assessment Tax Assessment Total Assessment is a certain percentage of the fair market value that is determined by local assessors to be the total taxable value of land and additions on the property. | Land | Improvement |
|---|---|---|---|---|
| 2025 | $1,696 | $219,385 | $0 | $0 |
| 2024 | $1,740 | $218,010 | $0 | $0 |
| 2023 | $18 | $214,090 | $0 | $0 |
| 2022 | $1,594 | $177,735 | $0 | $0 |
| 2021 | $1,505 | $259,220 | $46,100 | $213,120 |
| 2020 | $1,443 | $223,700 | $46,100 | $177,600 |
| 2019 | $1,205 | $178,788 | $46,100 | $132,688 |
| 2018 | $1,171 | $158,548 | $46,100 | $112,448 |
| 2017 | $1,055 | $75,570 | $0 | $0 |
| 2016 | $1,094 | $75,570 | $0 | $0 |
| 2015 | $1,095 | $75,570 | $0 | $0 |
| 2014 | $899 | $68,600 | $0 | $0 |
| 2013 | -- | $68,600 | $0 | $0 |
Source: Public Records
Map
Nearby Homes
- 1400 S 940 W
- 952 W 330 S
- 207 Sunstone Cir
- 1031 W 350 S
- 501 Southwest St
- 553 Center Ave
- 1099 Three Pointe Ave
- 370 S 1200 W Unit 2
- 562 S 1215 W Unit 135
- 226 S 600 W
- 508 S 1215 W Unit 144
- 539 S 1215 W Unit 129
- 551 S 1215 W Unit 131
- 1214 W 575 S
- 1204 W 575 S
- 1210 W 575 S Unit 163
- 1210 W 575 S
- 245 S 1280 W
- 1239 W 575 S
- 339 W Center St
Your Personal Tour Guide
Ask me questions while you tour the home.