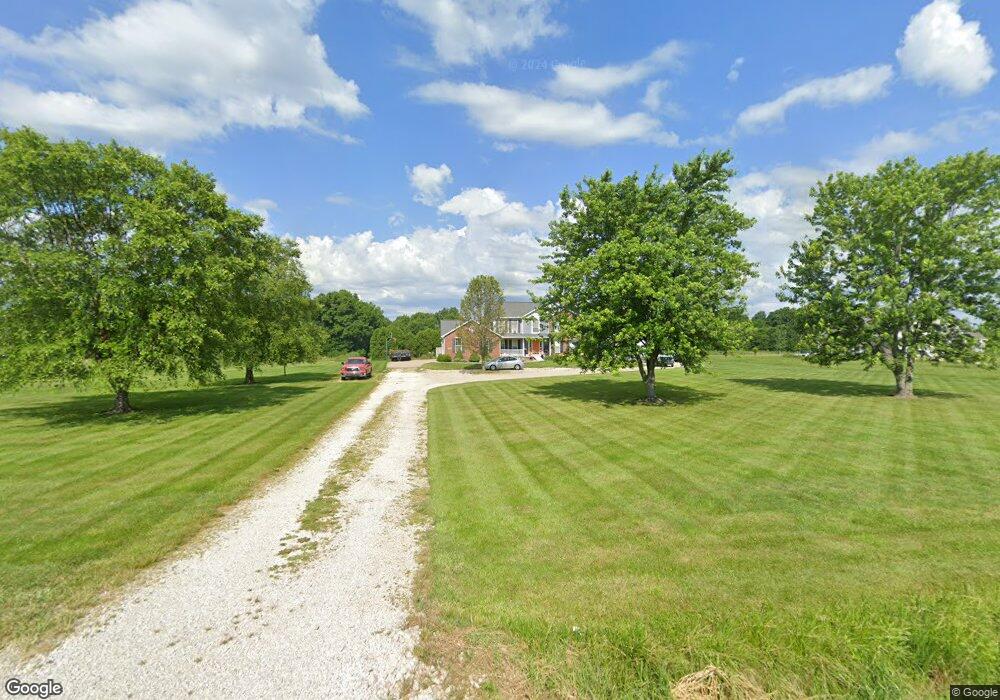
8980 Yoder Rd Wadsworth, OH 44281
Estimated Value: $445,000 - $587,086
4
Beds
3
Baths
2,428
Sq Ft
$204/Sq Ft
Est. Value
About This Home
This home is located at 8980 Yoder Rd, Wadsworth, OH 44281 and is currently estimated at $495,272, approximately $203 per square foot. 8980 Yoder Rd is a home located in Medina County with nearby schools including Isham Memorial Elementary School, Central Intermediate School, and Wadsworth Middle School.
Ownership History
Date
Name
Owned For
Owner Type
Purchase Details
Closed on
Sep 20, 2001
Sold by
21St Homes Inc
Bought by
Theders Michael B and Theders Gina M
Current Estimated Value
Home Financials for this Owner
Home Financials are based on the most recent Mortgage that was taken out on this home.
Original Mortgage
$225,450
Outstanding Balance
$88,361
Interest Rate
7.06%
Estimated Equity
$406,911
Purchase Details
Closed on
Mar 27, 2001
Sold by
Futamura Shingo and Futamura Sanae
Bought by
21St Homes Inc
Home Financials for this Owner
Home Financials are based on the most recent Mortgage that was taken out on this home.
Original Mortgage
$197,200
Interest Rate
7.03%
Mortgage Type
Construction
Create a Home Valuation Report for This Property
The Home Valuation Report is an in-depth analysis detailing your home's value as well as a comparison with similar homes in the area
Purchase History
| Date | Buyer | Sale Price | Title Company |
|---|---|---|---|
| Theders Michael B | $233,166 | -- | |
| 21St Homes Inc | $52,000 | -- |
Source: Public Records
Mortgage History
| Date | Status | Borrower | Loan Amount |
|---|---|---|---|
| Open | Theders Michael B | $225,450 | |
| Previous Owner | 21St Homes Inc | $197,200 |
Source: Public Records
Tax History
| Year | Tax Paid | Tax Assessment Tax Assessment Total Assessment is a certain percentage of the fair market value that is determined by local assessors to be the total taxable value of land and additions on the property. | Land | Improvement |
|---|---|---|---|---|
| 2024 | $7,738 | $158,540 | $47,730 | $110,810 |
| 2023 | $7,044 | $158,540 | $47,730 | $110,810 |
| 2022 | $7,083 | $158,540 | $47,730 | $110,810 |
| 2021 | $5,685 | $107,450 | $35,350 | $72,100 |
| 2020 | $5,182 | $107,450 | $35,350 | $72,100 |
| 2019 | $5,191 | $107,450 | $35,350 | $72,100 |
| 2018 | $5,010 | $97,020 | $32,810 | $64,210 |
| 2017 | $5,012 | $97,020 | $32,810 | $64,210 |
| 2016 | $5,110 | $97,020 | $32,810 | $64,210 |
| 2015 | $4,871 | $88,200 | $29,830 | $58,370 |
| 2014 | $4,874 | $88,200 | $29,830 | $58,370 |
| 2013 | $4,880 | $88,200 | $29,830 | $58,370 |
Source: Public Records
Map
Nearby Homes
- 3269 Greenwich Rd
- 3556 Blake Rd
- 2833 Harpster Rd
- 2833 Harpster Rd
- 8421 Wadsworth Rd
- 2644 Harpster Rd
- 230 Clifton Ln
- 105 Pin Oak Trail
- 103 Pin Oak Trail
- 8008 Wadsworth Rd
- 4833 Mandarin Dr
- 119 Center St
- 264 Chester Ave
- 4293 Good Rd
- 63 Center St
- 205 Oakwood Ln
- 2961 Kestrell Ln
- 443 Plum Creek Dr
- 312 Decourcey St
- 5052 Catawba Place Ln
- 9000 Yoder Rd
- 8950 Yoder Rd
- 8952 Yoder Rd
- 8936 Yoder Rd
- 9020 Yoder Rd
- S/L 3 Yoder Rd
- S/L 1 Yoder Rd
- 8900 Yoder Rd
- 9050 Yoder Rd
- 8909 Yoder Rd
- S/L 5 Yoder Rd
- 9053 Yoder Rd Unit 9055
- 9053 Yoder Rd
- 9055 Yoder Rd
- 8975 Rawiga Rd
- 3373 Greenwich Rd
- 9051 Rawiga Rd
- 8901 Rawiga Rd
- 8910 Rawiga Rd
- 9020 Rawiga Rd
Your Personal Tour Guide
Ask me questions while you tour the home.