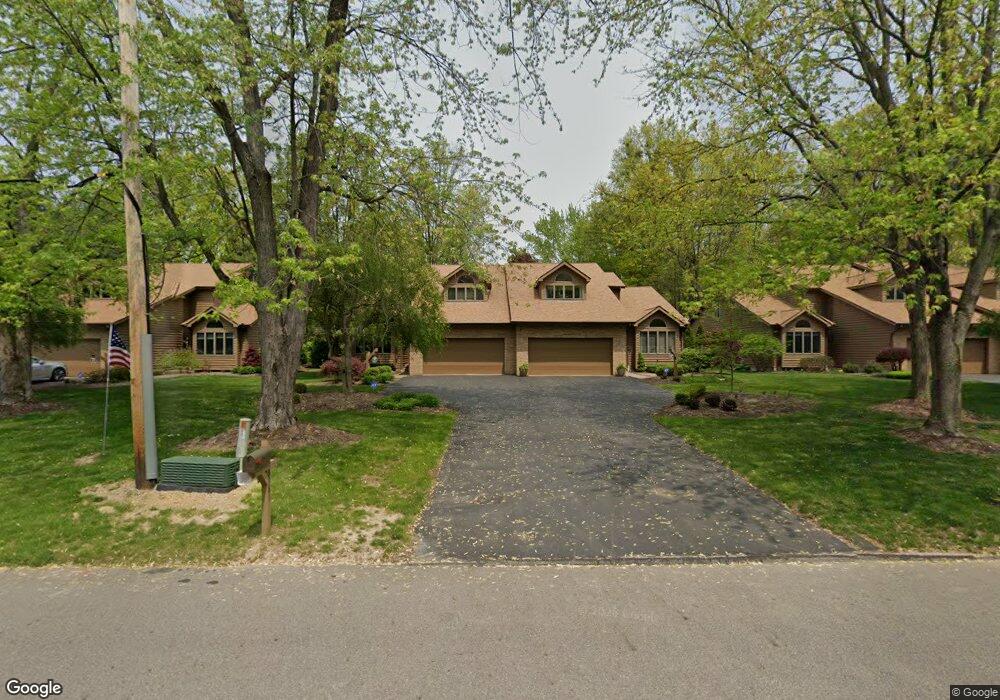
8981 Inverrary Dr SE Unit 3 Warren, OH 44484
Estimated Value: $277,378 - $392,000
2
Beds
2
Baths
2,616
Sq Ft
$119/Sq Ft
Est. Value
About This Home
This home is located at 8981 Inverrary Dr SE Unit 3, Warren, OH 44484 and is currently estimated at $310,345, approximately $118 per square foot. 8981 Inverrary Dr SE Unit 3 is a home located in Trumbull County with nearby schools including Howland High School and John F. Kennedy Catholic School - Lower Campus.
Ownership History
Date
Name
Owned For
Owner Type
Purchase Details
Closed on
Jul 11, 2005
Sold by
Henry Herbert Y
Bought by
Mcbane Alan R
Current Estimated Value
Home Financials for this Owner
Home Financials are based on the most recent Mortgage that was taken out on this home.
Original Mortgage
$55,500
Outstanding Balance
$27,955
Interest Rate
5.12%
Mortgage Type
Adjustable Rate Mortgage/ARM
Estimated Equity
$282,390
Purchase Details
Closed on
Jul 6, 2005
Sold by
Henry Herbert Y
Bought by
Mcbane Alan R and Mcbane Colin D
Home Financials for this Owner
Home Financials are based on the most recent Mortgage that was taken out on this home.
Original Mortgage
$55,500
Outstanding Balance
$27,955
Interest Rate
5.12%
Mortgage Type
Adjustable Rate Mortgage/ARM
Estimated Equity
$282,390
Purchase Details
Closed on
Jan 1, 1990
Sold by
Hoffman Leroy V
Bought by
Maxine B Henry
Create a Home Valuation Report for This Property
The Home Valuation Report is an in-depth analysis detailing your home's value as well as a comparison with similar homes in the area
Home Values in the Area
Average Home Value in this Area
Purchase History
| Date | Buyer | Sale Price | Title Company |
|---|---|---|---|
| Mcbane Alan R | $187,500 | -- | |
| Mcbane Alan R | $187,500 | -- | |
| Maxine B Henry | -- | -- |
Source: Public Records
Mortgage History
| Date | Status | Borrower | Loan Amount |
|---|---|---|---|
| Open | Mcbane Alan R | $55,500 | |
| Closed | Mcbane Alan R | $55,500 |
Source: Public Records
Tax History Compared to Growth
Tax History
| Year | Tax Paid | Tax Assessment Tax Assessment Total Assessment is a certain percentage of the fair market value that is determined by local assessors to be the total taxable value of land and additions on the property. | Land | Improvement |
|---|---|---|---|---|
| 2024 | $3,971 | $84,880 | $8,750 | $76,130 |
| 2023 | $3,971 | $84,880 | $8,750 | $76,130 |
| 2022 | $3,520 | $64,750 | $7,000 | $57,750 |
| 2021 | $3,438 | $64,750 | $7,000 | $57,750 |
| 2020 | $3,452 | $64,750 | $7,000 | $57,750 |
| 2019 | $3,645 | $64,750 | $7,000 | $57,750 |
| 2018 | $3,487 | $64,750 | $7,000 | $57,750 |
| 2017 | $3,135 | $64,750 | $7,000 | $57,750 |
| 2016 | $2,849 | $58,210 | $7,110 | $51,100 |
| 2015 | $2,778 | $58,210 | $7,110 | $51,100 |
| 2014 | $2,681 | $58,210 | $7,110 | $51,100 |
| 2013 | $2,665 | $58,210 | $7,110 | $51,100 |
Source: Public Records
Map
Nearby Homes
- 108 Riviera Ct SE
- 449 Westchester Dr SE
- 8570 Hunters Trail SE
- 203 B Dr NE
- 400 Hunters Hollow Dr SE
- 9043 Howland Springs Rd SE
- 8703 E Market St
- 8454 Hunters Trail SE
- 8530 E Market St
- 125 Northgate Dr NE
- 1546 Ohio 46
- 414 Wheelock Dr NE
- 428 Wheelock Dr NE
- 248 Darlington Rd NE
- 6 Niles Cortland Rd NE
- 498 & 514 Niles Cortland Rd SE
- 1283 Stillwagon Rd SE
- 8303 E Market St
- 580 Burning Oaks Dr NE
- 8305 Hiram Place SE
- 8985 Inverrary Dr SE
- 9021 Inverrary Dr SE Unit 5
- 8941 Inverrary Dr SE Unit 13
- 8945 Inverrary Dr SE
- 9075 Inverrary Dr SE
- 8937 Inverrary Dr SE
- 8933 Inverrary Dr SE
- 493 Howland Wilson Rd SE
- 8988 Inverrary Dr SE
- 8984 Inverrary Dr SE Unit 1
- 8976 Inverrary Dr SE Unit 2
- 8980 Inverrary Dr SE
- 8968 Inverrary Dr SE
- 8972 Inverrary Dr SE
- 9038 Inverrary Dr SE
- 9034 Inverrary Dr SE
- 9115 Inverrary Dr SE
- 9111 Inverrary Dr SE Unit 9
- 459 Howland Wilson Rd SE
- 9078 Inverrary Dr SE