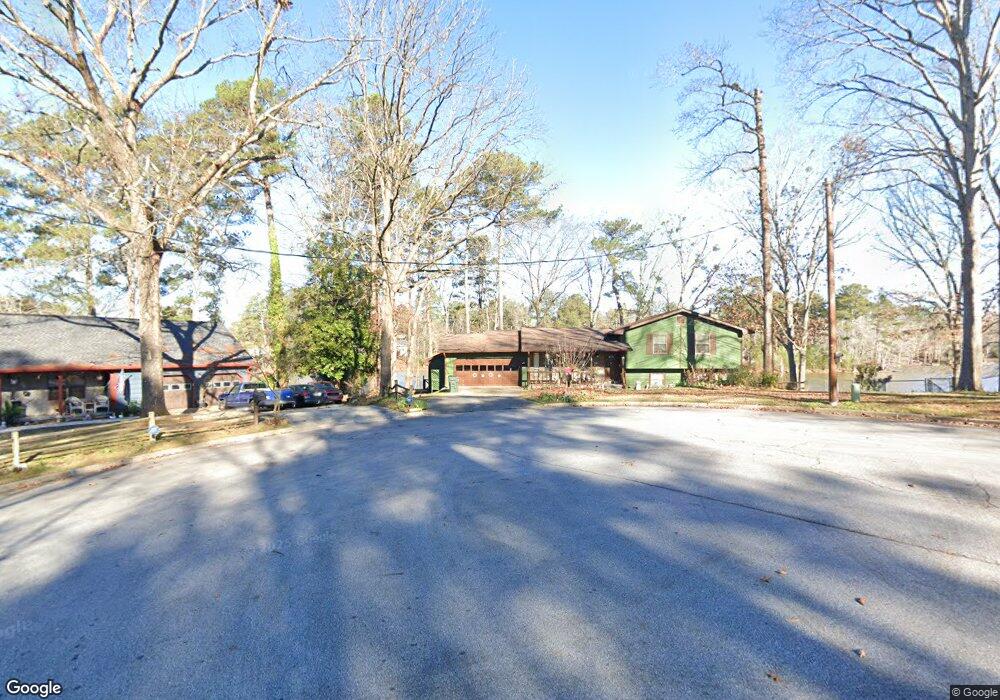
8984 Mandarin Ct Jonesboro, GA 30236
Estimated Value: $258,176 - $308,000
3
Beds
2
Baths
1,836
Sq Ft
$154/Sq Ft
Est. Value
About This Home
This home is located at 8984 Mandarin Ct, Jonesboro, GA 30236 and is currently estimated at $283,294, approximately $154 per square foot. 8984 Mandarin Ct is a home located in Clayton County with nearby schools including Suder Elementary School, M. D. Roberts Middle School, and Jonesboro High School.
Ownership History
Date
Name
Owned For
Owner Type
Purchase Details
Closed on
Dec 7, 2004
Sold by
Stahl David H
Bought by
Duncan Charlie L and Duncan Gloria
Current Estimated Value
Home Financials for this Owner
Home Financials are based on the most recent Mortgage that was taken out on this home.
Original Mortgage
$148,000
Interest Rate
5.66%
Mortgage Type
New Conventional
Purchase Details
Closed on
Aug 22, 2000
Sold by
Hammond Jeffrey
Bought by
Stahl Dasvid H
Home Financials for this Owner
Home Financials are based on the most recent Mortgage that was taken out on this home.
Original Mortgage
$138,400
Interest Rate
8.24%
Mortgage Type
New Conventional
Purchase Details
Closed on
Jun 12, 1997
Sold by
Foster Gary D
Bought by
Hammond Jeffrey
Home Financials for this Owner
Home Financials are based on the most recent Mortgage that was taken out on this home.
Original Mortgage
$127,800
Interest Rate
8.01%
Mortgage Type
New Conventional
Create a Home Valuation Report for This Property
The Home Valuation Report is an in-depth analysis detailing your home's value as well as a comparison with similar homes in the area
Home Values in the Area
Average Home Value in this Area
Purchase History
| Date | Buyer | Sale Price | Title Company |
|---|---|---|---|
| Duncan Charlie L | $185,000 | -- | |
| Stahl Dasvid H | $173,000 | -- | |
| Hammond Jeffrey | $142,000 | -- |
Source: Public Records
Mortgage History
| Date | Status | Borrower | Loan Amount |
|---|---|---|---|
| Previous Owner | Duncan Charlie L | $148,000 | |
| Previous Owner | Stahl Dasvid H | $138,400 | |
| Previous Owner | Hammond Jeffrey | $127,800 |
Source: Public Records
Tax History Compared to Growth
Tax History
| Year | Tax Paid | Tax Assessment Tax Assessment Total Assessment is a certain percentage of the fair market value that is determined by local assessors to be the total taxable value of land and additions on the property. | Land | Improvement |
|---|---|---|---|---|
| 2024 | $2,028 | $112,680 | $10,400 | $102,280 |
| 2023 | $3,899 | $108,000 | $10,400 | $97,600 |
| 2022 | $1,428 | $82,400 | $10,400 | $72,000 |
| 2021 | $1,271 | $73,400 | $10,400 | $63,000 |
| 2020 | $1,124 | $64,488 | $10,400 | $54,088 |
| 2019 | $1,108 | $62,092 | $9,600 | $52,492 |
| 2018 | $967 | $56,962 | $9,600 | $47,362 |
| 2017 | $845 | $49,135 | $9,600 | $39,535 |
| 2016 | $655 | $40,336 | $9,600 | $30,736 |
| 2015 | $525 | $0 | $0 | $0 |
| 2014 | $490 | $34,654 | $9,600 | $25,054 |
Source: Public Records
Map
Nearby Homes
- 9124 Ogala Ct
- 9132 Endicott Place
- 1558 Thornwood Ct
- 57 Teal Trail NE
- 111 Teal Trail
- 9176 Chickasaw Ct
- 8832 Twin Oaks Dr Unit 2
- 1726 Sherry Ln
- 1931 Lake Jodeco Rd
- 1738 Sherry Ln Unit 3
- 1457 Brownleaf Dr
- 1519 Red Briar Way
- 8698 Twin Oaks Dr
- 1485 Red Briar Way
- 9243 Seminole Rd
- 1976 Emerald Dr
- 304 Mercer Dr
- 116 Thornton Dr
- 242 Lake Jodeco Rd
- 8645 Embrey Dr
- 8985 Mandarin Ct
- 8996 Mandarin Ct
- 8993 Mandarin Ct
- 9009 Mandarin Dr
- 8999 Mandarin Ct Unit 10
- 8999 Mandarin Ct
- 8999 Mandarin Ct Unit 10
- 9005 Mandarin Dr
- 9021 Mandarin Dr
- 9010 Mandarin Dr
- 9020 Mandarin Dr Unit 4
- 9004 Mandarin Dr
- 0 Mandarin Dr Unit 8704197
- 0 Mandarin Dr Unit 8623550
- 0 Mandarin Dr Unit 8512273
- 0 Mandarin Dr Unit 8208544
- 0 Mandarin Dr Unit 7271292
- 0 Mandarin Dr Unit 8538813
- 0 Mandarin Dr Unit 9066952
- 0 Mandarin Dr Unit 8853597