C
Seller's Agent in 2025
Christine Pohlman
Dick Clark Real Estate, LLC
(567) 204-0028
20 Total Sales
Estimated Value: $218,000 - $261,000
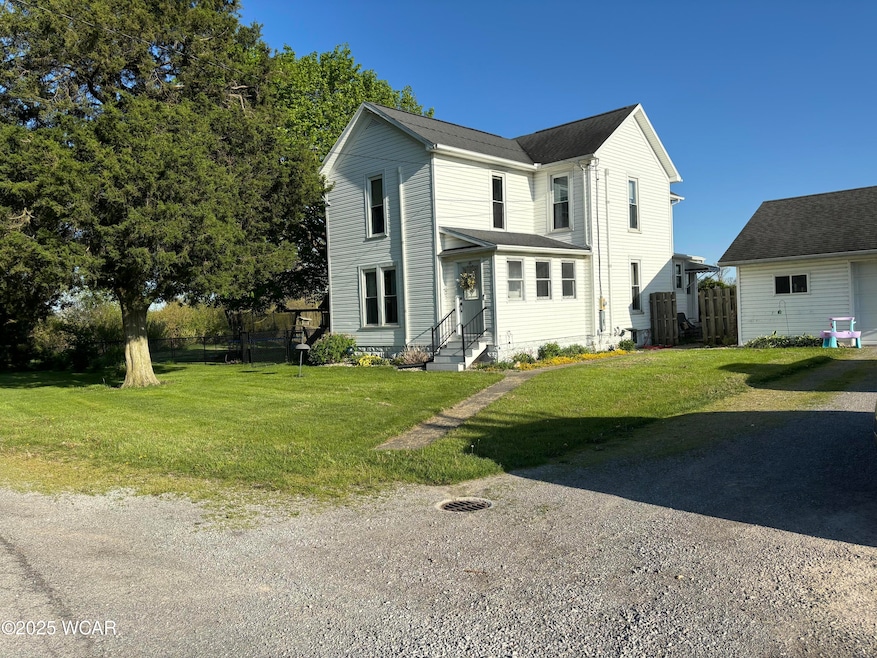
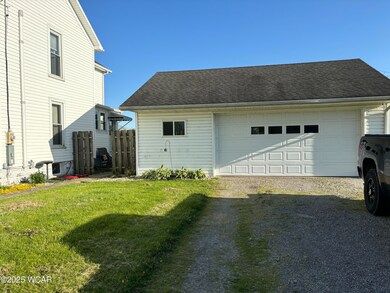
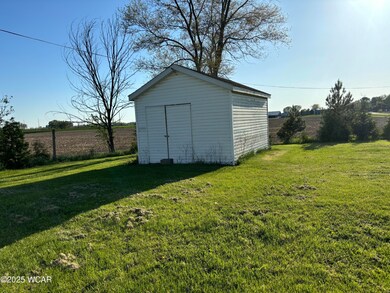
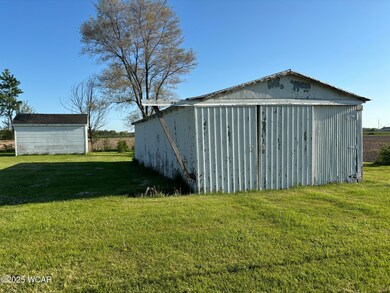
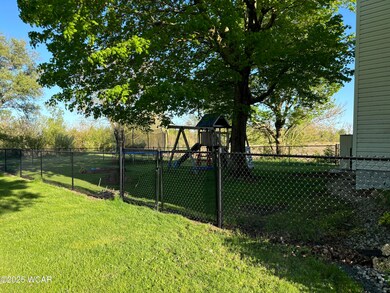
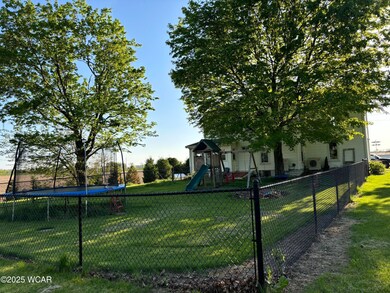
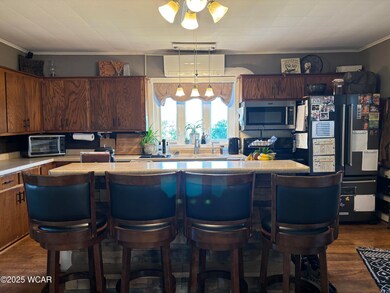
Welcome to 8989 Ridge Rd and the home to country living! This 2096 sq ft. home offers four spacious bedrooms, dining rm for hosting guests with a large, beautiful kitchen. Enjoy your morning coffee sitting in the sunroom watching the kids or furry friend play in the fenced in back yard. What could be better than walking out your back door to fish in the Little Auglaize River! New furnace-2024, Well pump-2024, Elec water heater-3yrs, kitchen bay window-3yrs. Don't miss your opportunity to own a piece of country bliss! Schedule your showing today.
Last Agent to Sell the Property
Dick Clark Real Estate, LLC License #2016002791 Listed on: 05/11/2025
We collect this data history from publicly available records. To have your information removed, we recommend requesting removal directly through your county’s website.
| Date | Buyer | Sale Price | Title Company |
|---|---|---|---|
| Brenneman Kyle C | $225,000 | None Listed On Document | |
| Baldauf Benjamin M | -- | None Available | |
| Baldauf Michael J | $71,500 | Attorney | |
| Sargent Donnie | $100,000 | -- |
We collect this data history from publicly available records. To have your information removed, we recommend requesting removal directly through your county’s website.
| Date | Status | Borrower | Loan Amount |
|---|---|---|---|
| Previous Owner | Baldauf Benjamin M | $63,100 | |
| Previous Owner | Baldauf Michael J | $57,200 | |
| Previous Owner | Sargent Donnie | $50,000 |
| Date | Event | Price | List to Sale | Price per Sq Ft |
|---|---|---|---|---|
| 06/05/2025 06/05/25 | Sold | $225,000 | -4.3% | $107 / Sq Ft |
| 05/17/2025 05/17/25 | Pending | -- | -- | -- |
| 05/11/2025 05/11/25 | For Sale | $235,000 | -- | $112 / Sq Ft |
| Year | Tax Paid | Tax Assessment Tax Assessment Total Assessment is a certain percentage of the fair market value that is determined by local assessors to be the total taxable value of land and additions on the property. | Land | Improvement |
|---|---|---|---|---|
| 2024 | $1,629 | $52,190 | $8,440 | $43,750 |
| 2023 | $1,338 | $40,470 | $6,550 | $33,920 |
| 2022 | $1,367 | $40,470 | $6,550 | $33,920 |
| 2021 | $1,371 | $40,470 | $6,550 | $33,920 |
| 2020 | $1,121 | $34,200 | $5,950 | $28,250 |
| 2019 | $1,121 | $34,200 | $5,950 | $28,250 |
| 2018 | $1,108 | $34,200 | $5,950 | $28,250 |
| 2017 | $1,037 | $31,640 | $5,950 | $25,690 |
| 2016 | $1,036 | $31,640 | $5,950 | $25,690 |
| 2015 | $913 | $31,640 | $5,950 | $25,690 |
| 2014 | $913 | $27,200 | $5,460 | $21,740 |
| 2013 | $914 | $27,200 | $5,460 | $21,740 |
C
Seller's Agent in 2025
Christine Pohlman
Dick Clark Real Estate, LLC
(567) 204-0028
20 Total Sales
S
Buyer's Agent in 2025
Sandy Kivimaki
CCR Realtors
(419) 905-6245
202 Total Sales
Source: West Central Association of REALTORS® (OH)
MLS Number: 307013
APN: 25-34-00-03-001.002
Ask me questions while you tour the home.
