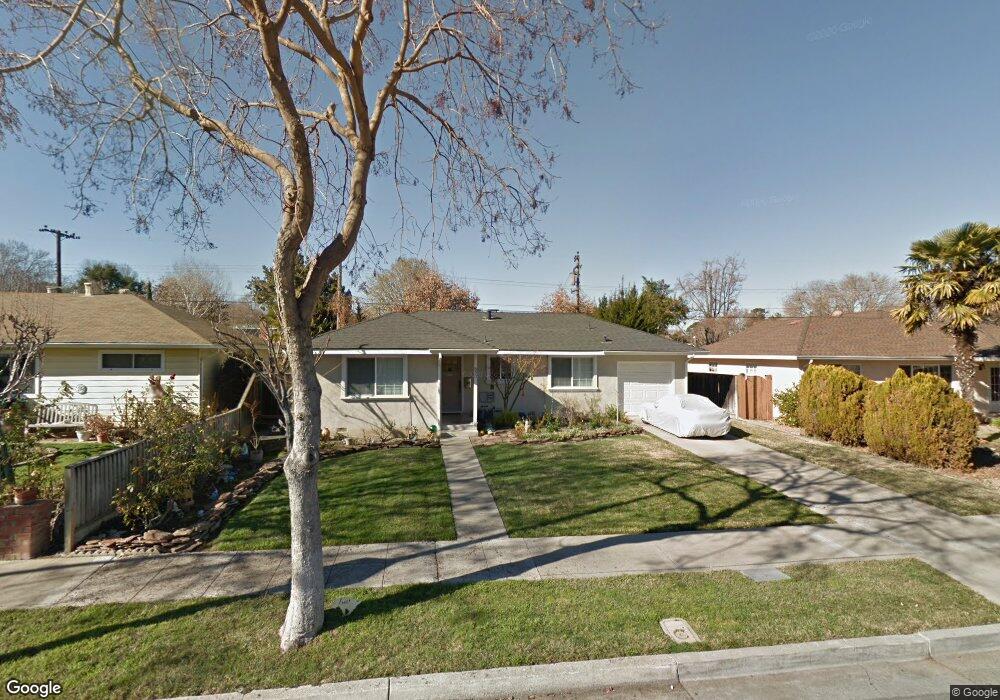
899 Mango Ave Sunnyvale, CA 94087
Sunnyvale AreaEstimated Value: $2,398,000 - $2,694,000
About This Home
This home is located at 899 Mango Ave, Sunnyvale, CA 94087 and is currently estimated at $2,546,590, approximately $2,206 per square foot. 899 Mango Ave is a home located in Santa Clara County with nearby schools including Cherry Chase Elementary School, Sunnyvale Middle School, and Homestead High School.
Ownership History
We collect this data history from publicly available records. To have your information removed, we recommend requesting removal directly through your county’s website.
Purchase Details
Purchase Details
Purchase Details
Purchase Details
Purchase Details
Purchase History
We collect this data history from publicly available records. To have your information removed, we recommend requesting removal directly through your county’s website.
| Date | Buyer | Sale Price | Title Company |
|---|---|---|---|
| -- | None Available | ||
| -- | None Available | ||
| $790,000 | Chicago Title | ||
| -- | Chicago Title | ||
| -- | -- | ||
| $535,000 | Financial Title Company | ||
| -- | Financial Title Company | ||
| -- | Financial Title Company |
Tax History
We collect this data history from publicly available records. To have your information removed, we recommend requesting removal directly through your county’s website.
| Year | Tax Paid | Tax Assessment Tax Assessment Total Assessment is a certain percentage of the fair market value that is determined by local assessors to be the total taxable value of land and additions on the property. | Land | Improvement |
|---|---|---|---|---|
| 2025 | $12,670 | $1,102,557 | $836,341 | $266,216 |
| 2024 | $12,670 | $1,080,940 | $819,943 | $260,997 |
| 2023 | $12,553 | $1,059,746 | $803,866 | $255,880 |
| 2022 | $12,347 | $1,038,967 | $788,104 | $250,863 |
| 2021 | $12,229 | $1,018,596 | $772,651 | $245,945 |
| 2020 | $12,076 | $1,008,153 | $764,729 | $243,424 |
| 2019 | $11,804 | $988,386 | $749,735 | $238,651 |
| 2018 | $11,583 | $969,007 | $735,035 | $233,972 |
| 2017 | $11,515 | $950,008 | $720,623 | $229,385 |
| 2016 | $11,071 | $931,382 | $706,494 | $224,888 |
| 2015 | $11,136 | $917,392 | $695,882 | $221,510 |
| 2014 | $10,918 | $899,422 | $682,251 | $217,171 |
Map
- 1083 Heatherstone Ave
- 821 Mulberry Ln
- 852 Peach Ave
- 1244 Parkington Ave
- 822 Elmira Dr
- 725 Blair Ct Unit F
- 1033 Crestview Dr Unit 110
- 1257 Gooseberry Ct
- 1031 Crestview Dr Unit 305
- 1031 Crestview Dr Unit 106
- 1142 Viscaino Ave
- 1354 Dale Ave Unit 9
- 880 Savory Dr
- 377 S Mary Ave
- 13220 Franklin Ave
- 585 Amherst Terrace
- 377 S Bernardo Ave
- 1265 Riesling Terrace
- 618 Sheraton Dr
- 346 Waverly St
Ask me questions while you tour the home.