
Landlord's Agent in 2024
Viktar Shemiako
Higgins Group Real Estate
(203) 524-2099
18 Total Sales
Estimated Value: $1,465,000 - $1,813,000
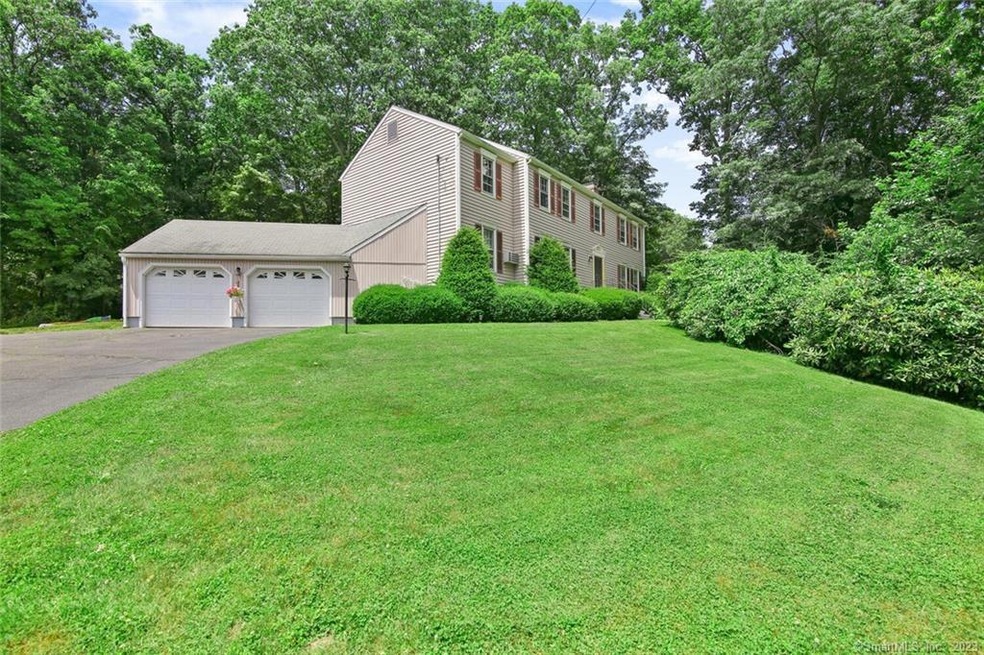
Conveniently located, spacious, Sunny, Bright, Large 4BR and 2.5 Bath Colonial House, 2,520SF. Hardwood floor throughout. 1st Floor with Formal DR, Formal LR, Kitchen, Separate Kitchen Dining Area, Sun Room with Sliding Glass Door to Back Deck and Half Bath; 2nd Floor offering 3 spacious bedrooms with shared bath, Master bedroom with office/sitting area, Updated Master Bath with large soaking tub/shower and Walk-In Closet. ,Unfinished basement with ample storage space.Laundry on main level. Brand New Boiler. 2 car garage .Minutes to Downtown, Train, restaurants, Merritt Pkwy and parks.
Last Agent to Rent the Property
Higgins Group Real Estate License #RES.0799079 Listed on: 10/07/2024
| Date | Buyer | Sale Price | Title Company |
|---|---|---|---|
| Kostareva Yevgeniya | -- | -- | |
| Kostareva Yevgeniya | $751,000 | -- |
| Date | Status | Borrower | Loan Amount |
|---|---|---|---|
| Previous Owner | Kostareva Yevgeniya | $600,000 |
| Date | Event | Price | List to Sale | Price per Sq Ft | Prior Sale |
|---|---|---|---|---|---|
| 12/10/2024 12/10/24 | Rented | $7,000 | -6.7% | -- | |
| 10/07/2024 10/07/24 | For Rent | $7,500 | +25.0% | -- | |
| 12/04/2023 12/04/23 | Rented | $6,000 | -7.7% | -- | |
| 11/07/2023 11/07/23 | Price Changed | $6,500 | -13.3% | $3 / Sq Ft | |
| 10/15/2023 10/15/23 | For Rent | $7,500 | 0.0% | -- | |
| 05/15/2023 05/15/23 | Rented | $7,500 | 0.0% | -- | |
| 05/11/2023 05/11/23 | Under Contract | -- | -- | -- | |
| 05/05/2023 05/05/23 | For Rent | $7,500 | +15.4% | -- | |
| 08/14/2021 08/14/21 | Rented | $6,500 | 0.0% | -- | |
| 08/01/2021 08/01/21 | Under Contract | -- | -- | -- | |
| 07/04/2021 07/04/21 | For Rent | $6,500 | +30.0% | -- | |
| 06/22/2020 06/22/20 | Rented | $5,000 | 0.0% | -- | |
| 04/25/2020 04/25/20 | For Rent | $5,000 | +13.6% | -- | |
| 07/06/2016 07/06/16 | Rented | $4,400 | -10.2% | -- | |
| 06/06/2016 06/06/16 | Under Contract | -- | -- | -- | |
| 05/05/2016 05/05/16 | For Rent | $4,900 | -1.0% | -- | |
| 06/16/2015 06/16/15 | Rented | $4,950 | +3.1% | -- | |
| 05/17/2015 05/17/15 | Under Contract | -- | -- | -- | |
| 04/30/2015 04/30/15 | For Rent | $4,800 | +14.3% | -- | |
| 04/23/2014 04/23/14 | Rented | $4,200 | -3.4% | -- | |
| 03/24/2014 03/24/14 | Under Contract | -- | -- | -- | |
| 03/07/2014 03/07/14 | For Rent | $4,350 | +6.1% | -- | |
| 03/21/2013 03/21/13 | Rented | $4,100 | 0.0% | -- | |
| 03/21/2013 03/21/13 | For Rent | $4,100 | 0.0% | -- | |
| 01/16/2013 01/16/13 | Sold | $751,000 | +0.1% | $298 / Sq Ft | View Prior Sale |
| 12/17/2012 12/17/12 | Pending | -- | -- | -- | |
| 11/16/2012 11/16/12 | For Sale | $750,000 | -- | $298 / Sq Ft |
| Year | Tax Paid | Tax Assessment Tax Assessment Total Assessment is a certain percentage of the fair market value that is determined by local assessors to be the total taxable value of land and additions on the property. | Land | Improvement |
|---|---|---|---|---|
| 2025 | $14,725 | $882,280 | $532,000 | $350,280 |
| 2024 | $14,240 | $882,280 | $532,000 | $350,280 |
| 2023 | $11,642 | $614,670 | $448,910 | $165,760 |
| 2022 | $11,291 | $614,670 | $448,910 | $165,760 |
| 2021 | $11,162 | $614,670 | $448,910 | $165,760 |
| 2020 | $11,162 | $614,670 | $448,910 | $165,760 |
| 2019 | $11,212 | $614,670 | $448,910 | $165,760 |
| 2018 | $12,851 | $757,750 | $445,410 | $312,340 |
| 2017 | $12,632 | $757,750 | $445,410 | $312,340 |
| 2016 | $12,359 | $757,750 | $445,410 | $312,340 |
| 2015 | $12,116 | $757,750 | $445,410 | $312,340 |
| 2014 | $11,775 | $757,750 | $445,410 | $312,340 |
Landlord's Agent in 2024
Viktar Shemiako
Higgins Group Real Estate
(203) 524-2099
18 Total Sales
Tenant's Agent in 2024
Jane Forte
Coldwell Banker Realty
(917) 697-4302
9 in this area
19 Total Sales
Seller's Agent in 2023
Elizabeth McMachan
William Raveis Real Estate
(203) 918-4784
1 in this area
28 Total Sales
Buyer's Agent in 2023
Susan Hanson
William Raveis Real Estate
(203) 247-3763
1 in this area
106 Total Sales
S
Buyer's Agent in 2021
Sondra Banford
Coldwell Banker Realty
Seller's Agent in 2020
Yulka Markevich
Iron Gates Realty
(203) 355-9536
2 in this area
74 Total Sales
Source: SmartMLS
MLS Number: 24051895
APN: NCAN-000042-000090-000042
Disclaimer: Certain information contained herein is derived from information provided by parties other than Homes.com. All information provided is deemed reliable, but is not guaranteed to be accurate and should be independently verified.
![]() IDX information is provided exclusively for personal, non-commercial use, and may not be used for any purpose other than to identify prospective properties consumers may be interested in purchasing. Information is deemed reliable but not guaranteed.
IDX information is provided exclusively for personal, non-commercial use, and may not be used for any purpose other than to identify prospective properties consumers may be interested in purchasing. Information is deemed reliable but not guaranteed.