899 Sea Eagle Loop Bodega Bay, CA 94923
Bodega Bay AreaEstimated Value: $1,726,000 - $2,456,000
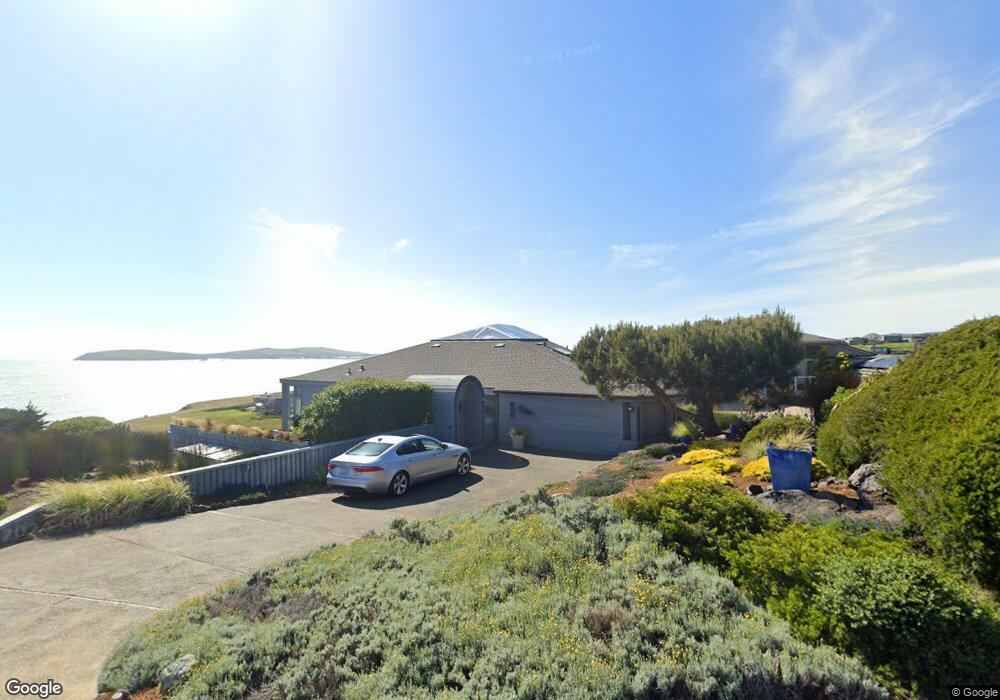
About This Home
This home is located at 899 Sea Eagle Loop, Bodega Bay, CA 94923 and is currently estimated at $2,138,929, approximately $855 per square foot. 899 Sea Eagle Loop is a home located in Sonoma County with nearby schools including Bodega Bay Elementary School and Tomales High School.
Ownership History
We collect this data history from publicly available records. To have your information removed, we recommend requesting removal directly through your county’s website.
Purchase Details
Purchase Details
Home Financials for this Owner
Home Financials are based on the most recent Mortgage that was taken out on this home.Purchase Details
Home Financials for this Owner
Home Financials are based on the most recent Mortgage that was taken out on this home.Purchase Details
Home Values in the Area
Average Home Value in this Area
Purchase History
We collect this data history from publicly available records. To have your information removed, we recommend requesting removal directly through your county’s website.
| Date | Buyer | Sale Price | Title Company |
|---|---|---|---|
| -- | None Available | ||
| -- | Fidelity National Title | ||
| $775,000 | Fidelity National Title Co | ||
| -- | None Available |
Mortgage History
We collect this data history from publicly available records. To have your information removed, we recommend requesting removal directly through your county’s website.
| Date | Status | Borrower | Loan Amount |
|---|---|---|---|
| Open | $500,000 | ||
| Closed | $500,000 |
Tax History
We collect this data history from publicly available records. To have your information removed, we recommend requesting removal directly through your county’s website.
| Year | Tax Paid | Tax Assessment Tax Assessment Total Assessment is a certain percentage of the fair market value that is determined by local assessors to be the total taxable value of land and additions on the property. | Land | Improvement |
|---|---|---|---|---|
| 2025 | $10,497 | $950,030 | $380,011 | $570,019 |
| 2024 | $10,461 | $931,403 | $372,560 | $558,843 |
| 2023 | $10,461 | $913,141 | $365,255 | $547,886 |
| 2022 | $10,133 | $895,238 | $358,094 | $537,144 |
| 2021 | $10,179 | $877,685 | $351,073 | $526,612 |
| 2020 | $10,413 | $868,687 | $347,474 | $521,213 |
| 2019 | $10,299 | $851,655 | $340,661 | $510,994 |
| 2018 | $0 | $834,957 | $333,982 | $500,975 |
| 2017 | $9,841 | $818,586 | $327,434 | $491,152 |
| 2016 | $9,693 | $802,536 | $321,014 | $481,522 |
| 2015 | -- | $790,483 | $316,193 | $474,290 |
| 2014 | -- | $775,000 | $310,000 | $465,000 |
Map
- 780 Kittiwake Ct
- 590 Swan Dr
- 424 Loon Ct
- 464 Loon Ct
- 300 Sanderling Ct
- 20997 Pelican Loop
- 114 Condor Ct
- 172 Condor Ct
- 21067 Heron Dr
- 21468 Heron Dr
- 16997 California 1
- 6083 California 1
- 2100 California 1
- 1968 Sea Way
- 1815 Sea Way
- 315 Mainsail Dr
- 2025 Dubloon Ct
- 141 Cypress Loop
- 88 Cypress Loop
- 153 Harbor View Way
- 849 Seaeagle Loop
- 887 Sea Eagle Loop
- 812 Kittiwake Ct
- 864 Sea Eagle Loop
- 873 Seaeagle Loop
- 820 Kittiwake Ct
- 870 Seaeagle Loop
- 1136 Sea Eagle Loop
- 804 Kittiwake Ct
- 894 Sea Eagle Loop
- 1148 Sea Eagle Loop
- 828 Kittiwake Ct
- 882 Seaeagle Loop
- 796 Kittiwake Ct
- 844 Kittiwake Ct
- 906 Sea Eagle Loop
- 836 Kittiwake Ct
- 20414 Meadowlark Ct
- 788 Kittiwake Ct
- 894 Seaeagle Loop
Ask me questions while you tour the home.