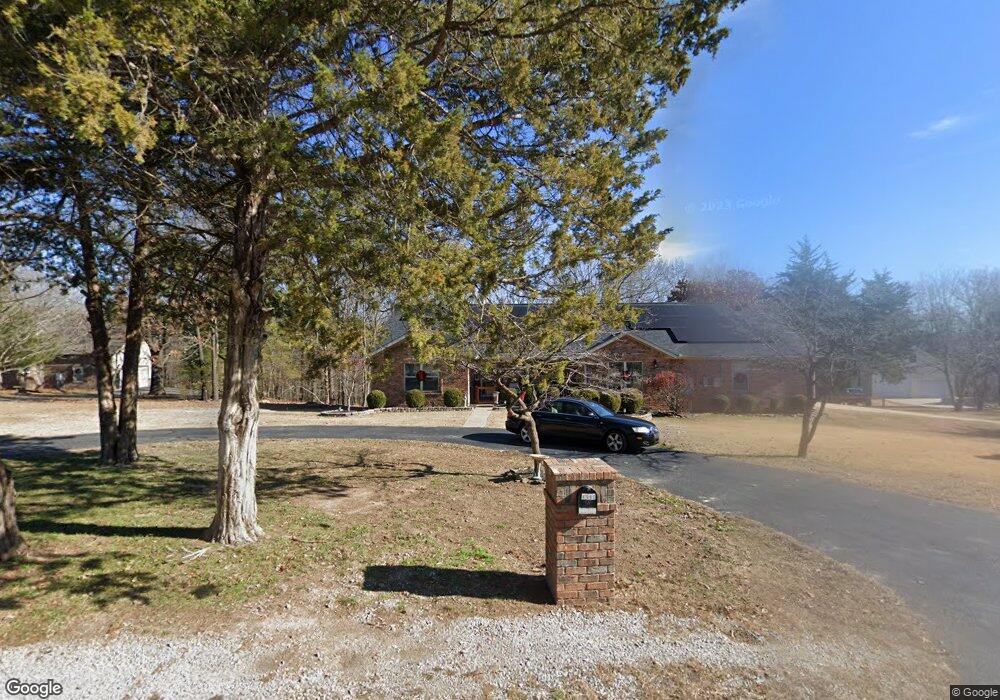
8990 Alicia Dawn Rd Rogers, AR 72758
Estimated Value: $505,000 - $633,000
4
Beds
2
Baths
2,680
Sq Ft
$207/Sq Ft
Est. Value
About This Home
This home is located at 8990 Alicia Dawn Rd, Rogers, AR 72758 and is currently estimated at $554,504, approximately $206 per square foot. 8990 Alicia Dawn Rd is a home located in Benton County with nearby schools including Jones Elementary School, Kirksey Middle School, and Rogers High School.
Ownership History
Date
Name
Owned For
Owner Type
Purchase Details
Closed on
Feb 27, 2017
Sold by
Hayes Rodney Lynn and Hayes Nicole E
Bought by
Hayes Rodney Lynn and Hayes Nicole E
Current Estimated Value
Purchase Details
Closed on
Mar 4, 2011
Sold by
Federal National Mortgage Association
Bought by
Hayes Rodney Lynn
Home Financials for this Owner
Home Financials are based on the most recent Mortgage that was taken out on this home.
Original Mortgage
$178,847
Interest Rate
4.78%
Mortgage Type
FHA
Purchase Details
Closed on
Sep 23, 2010
Sold by
Bank Of America N A
Bought by
Federal National Mortgage Association
Purchase Details
Closed on
Aug 15, 2007
Sold by
Allen Construction Co Inc
Bought by
Allen Gary D and Allen Joyce I
Purchase Details
Closed on
Jan 6, 2004
Bought by
Allen Construction
Create a Home Valuation Report for This Property
The Home Valuation Report is an in-depth analysis detailing your home's value as well as a comparison with similar homes in the area
Home Values in the Area
Average Home Value in this Area
Purchase History
| Date | Buyer | Sale Price | Title Company |
|---|---|---|---|
| Hayes Rodney Lynn | -- | Waco Title | |
| Hayes Rodney Lynn | $92,000 | None Available | |
| Federal National Mortgage Association | -- | None Available | |
| Bank Of America N A | $187,197 | None Available | |
| Allen Gary D | -- | None Available | |
| Allen Construction | $41,000 | -- | |
| Allen Construction | $41,000 | -- |
Source: Public Records
Mortgage History
| Date | Status | Borrower | Loan Amount |
|---|---|---|---|
| Previous Owner | Hayes Rodney Lynn | $178,847 |
Source: Public Records
Tax History Compared to Growth
Tax History
| Year | Tax Paid | Tax Assessment Tax Assessment Total Assessment is a certain percentage of the fair market value that is determined by local assessors to be the total taxable value of land and additions on the property. | Land | Improvement |
|---|---|---|---|---|
| 2025 | $3,120 | $102,878 | $19,853 | $83,025 |
| 2024 | $2,809 | $102,878 | $19,853 | $83,025 |
| 2023 | $2,675 | $71,610 | $15,510 | $56,100 |
| 2022 | $2,425 | $71,610 | $15,510 | $56,100 |
| 2021 | $2,293 | $71,610 | $15,510 | $56,100 |
| 2020 | $2,170 | $48,360 | $7,240 | $41,120 |
| 2019 | $2,170 | $48,360 | $7,240 | $41,120 |
| 2018 | $2,195 | $48,360 | $7,240 | $41,120 |
| 2017 | $2,026 | $48,360 | $7,240 | $41,120 |
| 2016 | $2,026 | $48,360 | $7,240 | $41,120 |
| 2015 | $2,380 | $49,490 | $9,820 | $39,670 |
| 2014 | $2,080 | $49,490 | $9,820 | $39,670 |
Source: Public Records
Map
Nearby Homes
- 0 Graham Ln
- TRACT A 3210 S Blue Hill Rd
- TRACT C 3210 S Blue Hill Rd
- 3300 Blue Hill Rd
- 13780 Crazy Horse Dr
- 0 Panorama Rd
- Lot 2 Esculapia Hollow Rd
- All Lots Esculapia Hollow Rd
- Lot 15 Esculapia Hollow Rd
- Lot 14 Esculapia Hollow Rd
- Lot 12 Esculapia Hollow Rd
- Lot 11 Esculapia Hollow Rd
- Lot 9 Esculapia Hollow Rd
- Lot 10 Esculapia Hollow Rd
- Lot 8 Esculapia Hollow Rd
- Lot 7 Esculapia Hollow Rd
- Lot 6 Esculapia Hollow Rd
- Lot 5 Esculapia Hollow Rd
- Lot 4 Esculapia Hollow Rd
- Lot 3 Esculapia Hollow Rd
- 8980 Alicia Dawn Rd
- 9111 Alicia Dawn Rd
- 9210 Alicia Dawn Rd
- 8955 Alicia Dawn Rd
- 8920 Alicia Dawn Rd
- 13602 Thomas Rd
- 9230 Alicia Dawn Rd
- 8955 Kennedy Rd
- 3505 Graham Ln
- 9125 Alicia Dawn Rd
- 8909 Alicia Dawn Rd
- 9233 Alicia Dawn Rd
- 8831 Panorama Rd
- 9233 Alicia Dawn Dr
- 13611 Thomas Rd
- 13620 Thomas Rd
- 8788 Panorama Rd
- 13784 Hill Valley Ln
- 8825 Panorama Rd
- 13624 Thomas Rd