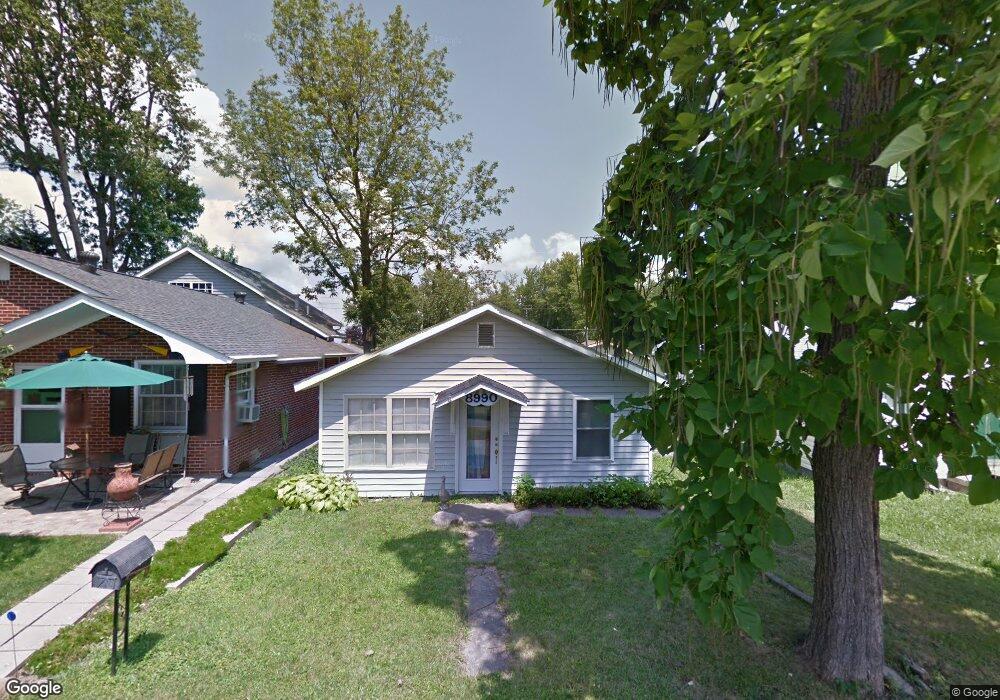
8990 Maple St Lakeview, OH 43331
Estimated Value: $116,308 - $193,000
1
Bed
1
Bath
624
Sq Ft
$252/Sq Ft
Est. Value
About This Home
This home is located at 8990 Maple St, Lakeview, OH 43331 and is currently estimated at $157,327, approximately $252 per square foot. 8990 Maple St is a home located in Logan County with nearby schools including Indian Lake Elementary School, Indian Lake Middle School, and Indian Lake High School.
Ownership History
Date
Name
Owned For
Owner Type
Purchase Details
Closed on
Dec 28, 2020
Sold by
Ogden Richard R and Ogden Susan M
Bought by
Gholson Anthony T and Cook Deanna R
Current Estimated Value
Home Financials for this Owner
Home Financials are based on the most recent Mortgage that was taken out on this home.
Original Mortgage
$198,320
Outstanding Balance
$175,264
Interest Rate
2.8%
Mortgage Type
New Conventional
Estimated Equity
-$17,937
Purchase Details
Closed on
Nov 23, 2020
Sold by
Richard Ogden Richard R Ogden Aka and Richard Susan Ogden
Bought by
Gholson Anthony T and Cook Deanna R
Home Financials for this Owner
Home Financials are based on the most recent Mortgage that was taken out on this home.
Original Mortgage
$198,320
Outstanding Balance
$175,264
Interest Rate
2.8%
Mortgage Type
New Conventional
Estimated Equity
-$17,937
Purchase Details
Closed on
May 20, 2010
Bought by
Garry J Bielanski
Purchase Details
Closed on
Mar 5, 2010
Bought by
Thomas R Zack
Purchase Details
Closed on
Feb 12, 2010
Sold by
Oty Frederick A
Bought by
Zack Thomas R
Purchase Details
Closed on
Oct 7, 2008
Bought by
Oty Frederick A Trustee
Purchase Details
Closed on
Sep 8, 2008
Bought by
Oty Frederick A
Create a Home Valuation Report for This Property
The Home Valuation Report is an in-depth analysis detailing your home's value as well as a comparison with similar homes in the area
Purchase History
| Date | Buyer | Sale Price | Title Company |
|---|---|---|---|
| Gholson Anthony T | $247,900 | Hanks John C | |
| Gholson Anthony T | $247,900 | None Available | |
| Garry J Bielanski | $15,000 | -- | |
| Thomas R Zack | $12,500 | -- | |
| Zack Thomas R | $12,500 | -- | |
| Oty Frederick A Trustee | -- | -- | |
| Oty Frederick A | -- | -- |
Source: Public Records
Mortgage History
| Date | Status | Borrower | Loan Amount |
|---|---|---|---|
| Open | Gholson Anthony T | $198,320 | |
| Closed | Gholson Anthony T | $198,320 |
Source: Public Records
Tax History
| Year | Tax Paid | Tax Assessment Tax Assessment Total Assessment is a certain percentage of the fair market value that is determined by local assessors to be the total taxable value of land and additions on the property. | Land | Improvement |
|---|---|---|---|---|
| 2025 | $1,313 | $32,810 | $11,650 | $21,160 |
| 2024 | $1,313 | $23,250 | $5,340 | $17,910 |
| 2023 | $1,029 | $23,250 | $5,340 | $17,910 |
| 2022 | $1,083 | $16,050 | $3,690 | $12,360 |
| 2021 | $804 | $16,050 | $3,690 | $12,360 |
| 2020 | $805 | $13,780 | $3,160 | $10,620 |
| 2019 | $812 | $13,780 | $3,160 | $10,620 |
| 2018 | $674 | $13,780 | $3,160 | $10,620 |
| 2016 | $574 | $11,220 | $2,870 | $8,350 |
| 2014 | $512 | $11,220 | $2,870 | $8,350 |
| 2013 | $486 | $11,220 | $2,870 | $8,350 |
| 2012 | $446 | $8,830 | $3,160 | $5,670 |
Source: Public Records
Map
Nearby Homes
- 9050 Elm St
- 10027 Township Road 253
- 8959 Crescent St
- 8874 Crescent St
- 8921 Park St
- 0 Orchard Ave
- 9895 Fairview Dr
- 9596 Orchard Dr
- 9895 Fairview Ave
- 10110 Township Road 253
- 285 N Orchard Island Rd Unit lot 66
- 241 Chase Ave Unit B4
- 241 Chase Ave Unit C2L
- 241 Chase Ave Unit C2U
- 241 Chase Ave Unit 3-D-U
- 241 Chase Ave Unit D3U
- 222 Warren Ave Unit 3
- 218 Warren Ave Unit 8
- 134 Brads Way
- 246 N Orchard Island Dr Unit Lot 45
Your Personal Tour Guide
Ask me questions while you tour the home.