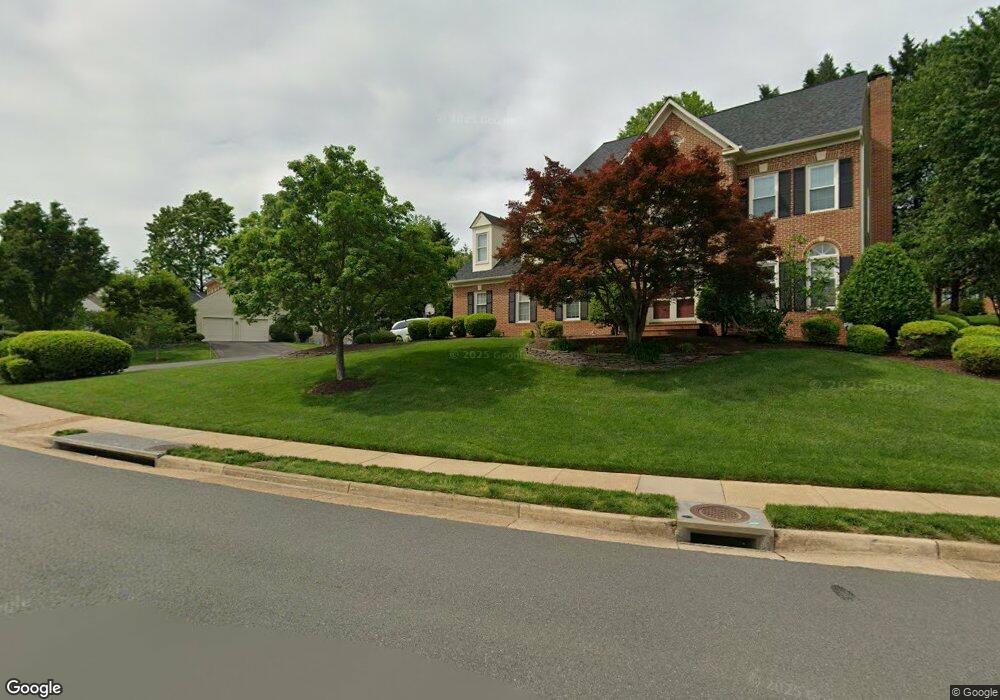
8992 Scott St Springfield, VA 22153
Estimated Value: $1,101,000 - $1,187,000
4
Beds
3
Baths
3,382
Sq Ft
$338/Sq Ft
Est. Value
About This Home
This home is located at 8992 Scott St, Springfield, VA 22153 and is currently estimated at $1,142,038, approximately $337 per square foot. 8992 Scott St is a home located in Fairfax County with nearby schools including Sangster Elementary School, Lake Braddock Secondary School, and Sydenstricker School.
Ownership History
Date
Name
Owned For
Owner Type
Purchase Details
Closed on
Nov 29, 2022
Sold by
Lai Phuong Melinda Lan
Bought by
Phuong Melinda Lan Lai Living Trust
Current Estimated Value
Purchase Details
Closed on
Dec 9, 2008
Sold by
Primacy Closing Corp
Bought by
Lai Phuong L
Purchase Details
Closed on
Sep 26, 2008
Sold by
Kee Gregory L
Bought by
Primacy Closing Corp
Purchase Details
Closed on
Dec 20, 1994
Sold by
Belleau Wood Inc
Bought by
Kee Gregory L
Home Financials for this Owner
Home Financials are based on the most recent Mortgage that was taken out on this home.
Original Mortgage
$311,850
Interest Rate
9.03%
Create a Home Valuation Report for This Property
The Home Valuation Report is an in-depth analysis detailing your home's value as well as a comparison with similar homes in the area
Home Values in the Area
Average Home Value in this Area
Purchase History
| Date | Buyer | Sale Price | Title Company |
|---|---|---|---|
| Phuong Melinda Lan Lai Living Trust | -- | None Listed On Document | |
| Phuong Melinda Lan Lai Living Trust | -- | None Listed On Document | |
| Lai Phuong L | $625,000 | -- | |
| Primacy Closing Corp | $675,000 | -- | |
| Kee Gregory L | $320,035 | -- |
Source: Public Records
Mortgage History
| Date | Status | Borrower | Loan Amount |
|---|---|---|---|
| Previous Owner | Kee Gregory L | $311,850 |
Source: Public Records
Tax History
| Year | Tax Paid | Tax Assessment Tax Assessment Total Assessment is a certain percentage of the fair market value that is determined by local assessors to be the total taxable value of land and additions on the property. | Land | Improvement |
|---|---|---|---|---|
| 2025 | $12,110 | $1,089,290 | $342,000 | $747,290 |
| 2024 | $12,110 | $1,045,280 | $327,000 | $718,280 |
| 2023 | $11,371 | $1,007,610 | $327,000 | $680,610 |
| 2022 | $10,335 | $903,830 | $292,000 | $611,830 |
| 2021 | $9,319 | $794,130 | $247,000 | $547,130 |
| 2020 | $9,107 | $769,480 | $242,000 | $527,480 |
| 2019 | $9,184 | $776,040 | $242,000 | $534,040 |
| 2018 | $8,809 | $766,040 | $232,000 | $534,040 |
| 2017 | $8,894 | $766,040 | $232,000 | $534,040 |
| 2016 | $8,990 | $776,020 | $232,000 | $544,020 |
| 2015 | $8,293 | $743,080 | $232,000 | $511,080 |
| 2014 | $8,035 | $721,580 | $222,000 | $499,580 |
Source: Public Records
Map
Nearby Homes
- 9005 Penn Manor Ct
- 7923 Valleyfield Dr
- 8019 Galla Knoll Cir
- 8737 Redman St
- 9115 Northedge Dr
- 7801 Blue Jasmine Ct
- 7604 Bertito Ln
- 8108 Steeple Chase Ct
- 7508 Irene Ct
- 7702 Newington Forest Ave
- 8735 Stone Hill Place
- 8217 Bayberry Ridge Rd
- 8677 Hickory Ridge Ct
- 8733 Cuttermill Place
- 9117 John Way
- 8816 Arley Dr
- 9022 Gavelwood Ct
- 8309 Linden Oaks Ct
- 8739 Arley Dr
- 9315 Hallston Ct
Your Personal Tour Guide
Ask me questions while you tour the home.