Estimated Value: $836,765
--
Bed
1
Bath
2,376
Sq Ft
$352/Sq Ft
Est. Value
About This Home
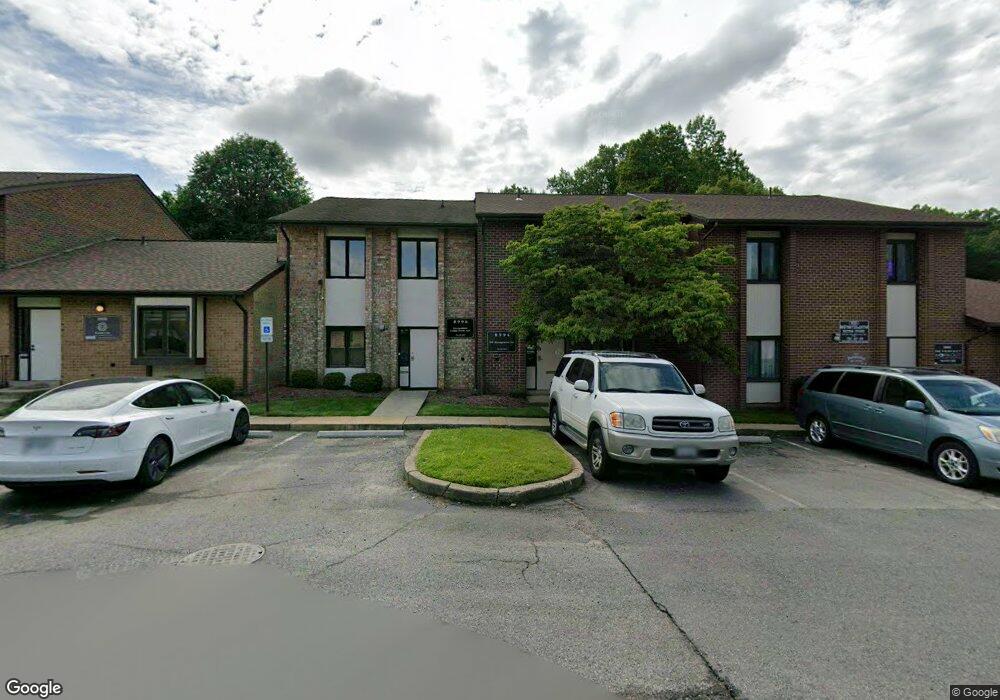
This home is located at 8994 Fern Park Dr Unit 5, Burke, VA 22015 and is currently estimated at $836,765, approximately $352 per square foot. 8994 Fern Park Dr Unit 5 is a home located in Fairfax County with nearby schools including Kings Park Elementary School, Kings Glen Elementary School, and Lake Braddock Secondary School.
Ownership History
Date
Name
Owned For
Owner Type
Purchase Details
Closed on
Jul 26, 2016
Sold by
Sates Llc
Bought by
Gav Realty Llc
Current Estimated Value
Home Financials for this Owner
Home Financials are based on the most recent Mortgage that was taken out on this home.
Original Mortgage
$464,000
Outstanding Balance
$370,933
Interest Rate
3.54%
Mortgage Type
New Conventional
Estimated Equity
$465,832
Purchase Details
Closed on
Oct 10, 2007
Sold by
Morrow J Phillip
Bought by
Sates Llc
Home Financials for this Owner
Home Financials are based on the most recent Mortgage that was taken out on this home.
Original Mortgage
$524,000
Interest Rate
6.49%
Mortgage Type
Purchase Money Mortgage
Purchase Details
Closed on
Mar 26, 1981
Bought by
Olenyn Paul T and And Rose A
Purchase Details
Closed on
Feb 15, 1980
Bought by
Bledsoe Jack D and And Geneva K
Create a Home Valuation Report for This Property
The Home Valuation Report is an in-depth analysis detailing your home's value as well as a comparison with similar homes in the area
Home Values in the Area
Average Home Value in this Area
Purchase History
| Date | Buyer | Sale Price | Title Company |
|---|---|---|---|
| Gav Realty Llc | $575,000 | Sms Title & Escrow Inc | |
| Sates Llc | $655,000 | -- | |
| Olenyn Paul T | $158,400 | -- | |
| Bledsoe Jack D | $105,300 | -- |
Source: Public Records
Mortgage History
| Date | Status | Borrower | Loan Amount |
|---|---|---|---|
| Open | Gav Realty Llc | $464,000 | |
| Previous Owner | Sates Llc | $524,000 |
Source: Public Records
Tax History Compared to Growth
Tax History
| Year | Tax Paid | Tax Assessment Tax Assessment Total Assessment is a certain percentage of the fair market value that is determined by local assessors to be the total taxable value of land and additions on the property. | Land | Improvement |
|---|---|---|---|---|
| 2025 | $5,032 | $415,800 | $83,160 | $332,640 |
| 2024 | $5,032 | $392,040 | $78,410 | $313,630 |
| 2023 | $4,914 | $392,040 | $78,410 | $313,630 |
| 2022 | $4,483 | $392,040 | $78,410 | $313,630 |
| 2021 | $5,862 | $451,440 | $90,290 | $361,150 |
| 2020 | $6,218 | $475,200 | $95,040 | $380,160 |
| 2019 | $6,218 | $475,200 | $95,040 | $380,160 |
| 2018 | $5,465 | $475,200 | $95,040 | $380,160 |
| 2017 | $7,028 | $546,480 | $109,300 | $437,180 |
| 2016 | $6,465 | $503,710 | $100,740 | $402,970 |
| 2015 | $6,487 | $522,720 | $104,540 | $418,180 |
| 2014 | $6,474 | $522,720 | $104,540 | $418,180 |
Source: Public Records
Map
Nearby Homes
- 8909 Victoria Rd
- 5009 King David Blvd
- 9104 Parliament Dr
- 5055 Kenerson Dr
- 9009 Digory Ct
- 5039 Kenerson Dr
- 0 Lower Cranberry Lake Unit 1624408
- 4925 Bexley Ln
- 5432 Brixham Ct
- 5511 Callander Dr
- 4721 Springbrook Dr
- 5613 Mount Burnside Way
- 8611 Canterbury Dr
- 9438 Wallingford Dr
- 9001 Fox Lair Dr
- 5502 Saddlebrook Ct
- 9370 Colbert Ct
- 8602 Dora Ct
- 5639 Fort Corloran Dr
- 5205 Southampton Dr
- 8994 Fern Park Dr
- 8996 Fern Park Dr
- 8992 Fern Park Dr
- 8992 Fern Park Dr Unit 6
- 8998 Fern Park Dr Unit 3
- 8998 Fern Park Dr
- 8990 Fern Park Dr
- 8990 Fern Park Dr Unit B
- 8990 Fern Park Dr Unit 7
- 9000 Fern Park Dr Unit BASEMENT
- 9000 Fern Park Dr Unit LOWER LEVEL
- 9000 Fern Park Dr Unit 2
- 9000 Fern Park Dr
- 9002 Fern Park Dr
- 5213-A Lyngate Ct
- 8987 Hersand Dr
- 5213-B Lyngate Ct
- 5244 Lyngate Ct Unit 5244
- 5240 Lyngate Ct
- 5213 Lyngate Ct Unit 43