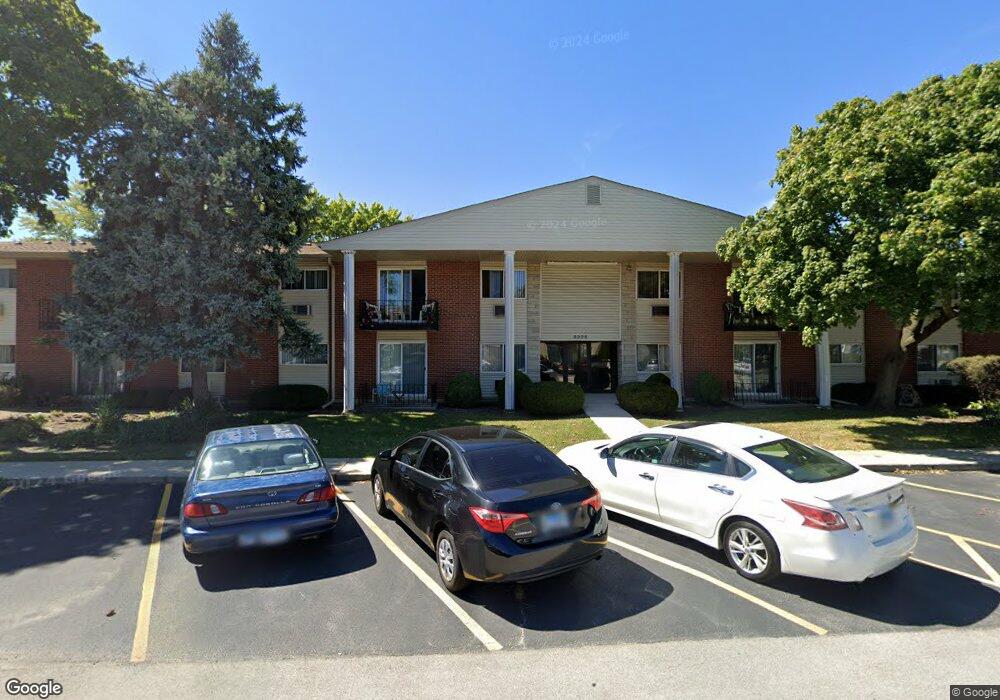
8998 Kennedy Dr Unit 206F Des Plaines, IL 60016
Estimated Value: $152,000 - $212,000
4
Beds
--
Bath
18,330
Sq Ft
$10/Sq Ft
Est. Value
About This Home
This home is located at 8998 Kennedy Dr Unit 206F, Des Plaines, IL 60016 and is currently estimated at $174,848, approximately $9 per square foot. 8998 Kennedy Dr Unit 206F is a home located in Cook County with nearby schools including Apollo Elementary School, Gemini Middle School, and Maine East High School.
Ownership History
Date
Name
Owned For
Owner Type
Purchase Details
Closed on
Jun 1, 2020
Sold by
Plesa Dan and Plesa Carmen
Bought by
Moore Dawn
Current Estimated Value
Home Financials for this Owner
Home Financials are based on the most recent Mortgage that was taken out on this home.
Original Mortgage
$91,675
Outstanding Balance
$82,077
Interest Rate
3.75%
Mortgage Type
New Conventional
Estimated Equity
$92,771
Purchase Details
Closed on
Sep 15, 2016
Sold by
Nrz Reo V2 Corp
Bought by
Plesa Dan
Purchase Details
Closed on
Sep 7, 2016
Sold by
Deutsche Bank Trust Co
Bought by
Nrz Reo V2 Corp
Purchase Details
Closed on
Feb 10, 2016
Sold by
Simonkova Renata
Bought by
Deutsche Bank Trust Company Americas
Purchase Details
Closed on
Dec 3, 2002
Sold by
Troost Joanne M and Troost Rhodes Deidra A
Bought by
Simonkova Renata
Home Financials for this Owner
Home Financials are based on the most recent Mortgage that was taken out on this home.
Original Mortgage
$112,950
Interest Rate
6.23%
Create a Home Valuation Report for This Property
The Home Valuation Report is an in-depth analysis detailing your home's value as well as a comparison with similar homes in the area
Home Values in the Area
Average Home Value in this Area
Purchase History
| Date | Buyer | Sale Price | Title Company |
|---|---|---|---|
| Moore Dawn | $96,500 | Altima Title Llc | |
| Plesa Dan | $61,000 | Attorney | |
| Nrz Reo V2 Corp | -- | None Available | |
| Deutsche Bank Trust Company Americas | -- | Attorney | |
| Simonkova Renata | $125,500 | -- |
Source: Public Records
Mortgage History
| Date | Status | Borrower | Loan Amount |
|---|---|---|---|
| Open | Moore Dawn | $91,675 | |
| Previous Owner | Simonkova Renata | $112,950 |
Source: Public Records
Tax History Compared to Growth
Tax History
| Year | Tax Paid | Tax Assessment Tax Assessment Total Assessment is a certain percentage of the fair market value that is determined by local assessors to be the total taxable value of land and additions on the property. | Land | Improvement |
|---|---|---|---|---|
| 2024 | $2,841 | $10,482 | $527 | $9,955 |
| 2023 | $2,701 | $10,482 | $527 | $9,955 |
| 2022 | $2,701 | $10,482 | $527 | $9,955 |
| 2021 | $1,710 | $5,444 | $810 | $4,634 |
| 2020 | $718 | $5,444 | $810 | $4,634 |
| 2019 | $718 | $6,092 | $810 | $5,282 |
| 2018 | $658 | $5,574 | $708 | $4,866 |
| 2017 | $1,690 | $5,574 | $708 | $4,866 |
| 2016 | $871 | $5,574 | $708 | $4,866 |
| 2015 | $834 | $2,699 | $607 | $2,092 |
| 2014 | $39 | $2,699 | $607 | $2,092 |
| 2013 | -- | $2,699 | $607 | $2,092 |
Source: Public Records
Map
Nearby Homes
- 8999 Kennedy Dr Unit 102B
- 8846 Dee Rd Unit E
- 9332 Landings Ln Unit 504
- 8810 Briar Ct Unit 1B
- 9355 Landings Ln Unit 406
- 9356 Landings Ln Unit 505
- 9356 Landings Ln Unit 403
- 9375 Landings Ln Unit 407
- 9396 Landings Ln Unit 203
- 9396 Landings Ln Unit 207
- 9396 Landings Ln Unit 404
- 9396 Landings Ln Unit 506
- 9396 Landings Ln Unit 206
- 9396 Landings Ln Unit 602
- 9396 Landings Ln Unit 605
- 9395 Landings Ln Unit 401
- 9395 Landings Ln Unit 302
- 1710 Dempster St Unit A
- 9205 Potter Rd Unit 1C
- 9205 Potter Rd Unit 2H
- 8998 Kennedy Dr Unit 1A
- 8998 Kennedy Dr Unit 204D
- 8998 Kennedy Dr Unit 108H
- 8998 Kennedy Dr Unit 102B
- 8998 Kennedy Dr Unit 202
- 8998 Kennedy Dr Unit 203C
- 8998 Kennedy Dr Unit 103C
- 8998 Kennedy Dr Unit 106F
- 8998 Kennedy Dr Unit 208H
- 8998 Kennedy Dr Unit 101A
- 8998 Kennedy Dr Unit 201A
- 8998 Kennedy Dr Unit 202B
- 8998 Kennedy Dr Unit 205E
- 8998 Kennedy Dr Unit 104D
- 8998 Kennedy Dr Unit 207G
- 8998 Kennedy Dr Unit 107G
- 8998 Kennedy Dr Unit 105E
- 8998 Kennedy Dr Unit 2F
- 8998 Kennedy Dr Unit 1C
- 8998 Kennedy Dr Unit 2H