Estimated Value: $162,000 - $278,000
7
Beds
2
Baths
1,985
Sq Ft
$100/Sq Ft
Est. Value
About This Home
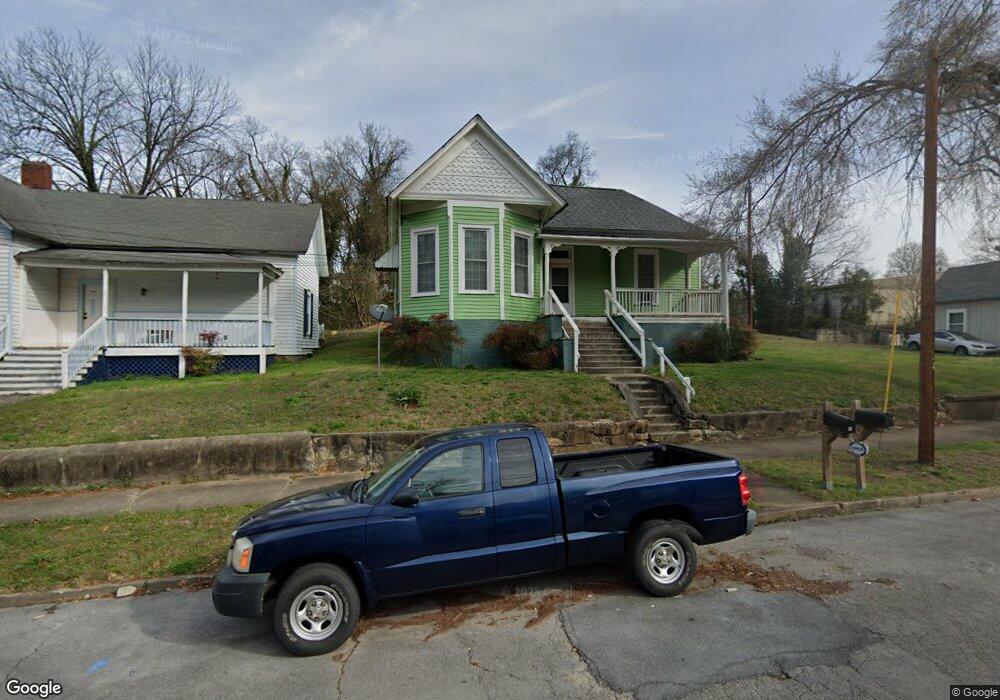
This home is located at 8A Butler St SW, Rome, GA 30161 and is currently estimated at $199,262, approximately $100 per square foot. 8A Butler St SW is a home located in Floyd County with nearby schools including Dan McCarty Middle School, Rome High School, and Darlington School.
Ownership History
Date
Name
Owned For
Owner Type
Purchase Details
Closed on
Aug 7, 2020
Sold by
Riddle G H
Bought by
Owen Marion M
Current Estimated Value
Home Financials for this Owner
Home Financials are based on the most recent Mortgage that was taken out on this home.
Original Mortgage
$86,475
Outstanding Balance
$76,709
Interest Rate
3%
Mortgage Type
New Conventional
Estimated Equity
$122,553
Purchase Details
Closed on
Jan 15, 1988
Sold by
Coultas Michael A
Bought by
Riddle G H
Purchase Details
Closed on
Dec 5, 1983
Sold by
Goltfelty John S and Coultas Michael A
Bought by
Coultas Michael A
Purchase Details
Closed on
Oct 1, 1982
Sold by
Tuck Billy and Tuck Martha A
Bought by
Goltfelty John S and Coultas Michael
Purchase Details
Closed on
May 22, 1981
Sold by
Jeffery Paul H and Jeffery Emma J
Bought by
Tuck Billy and Tuck Martha A
Purchase Details
Closed on
Oct 23, 1980
Sold by
Bradshaw Hg Mrs
Bought by
Jeffery Paul H and Jeffery Emma J
Purchase Details
Closed on
Jan 1, 1901
Bought by
Bradshaw Hg Mrs
Create a Home Valuation Report for This Property
The Home Valuation Report is an in-depth analysis detailing your home's value as well as a comparison with similar homes in the area
Home Values in the Area
Average Home Value in this Area
Purchase History
| Date | Buyer | Sale Price | Title Company |
|---|---|---|---|
| Owen Marion M | $115,300 | -- | |
| Riddle G H | $15,300 | -- | |
| Coultas Michael A | $5,000 | -- | |
| Goltfelty John S | $12,500 | -- | |
| Tuck Billy | -- | -- | |
| Jeffery Paul H | $20,000 | -- | |
| Bradshaw Hg Mrs | -- | -- |
Source: Public Records
Mortgage History
| Date | Status | Borrower | Loan Amount |
|---|---|---|---|
| Open | Owen Marion M | $86,475 |
Source: Public Records
Tax History Compared to Growth
Tax History
| Year | Tax Paid | Tax Assessment Tax Assessment Total Assessment is a certain percentage of the fair market value that is determined by local assessors to be the total taxable value of land and additions on the property. | Land | Improvement |
|---|---|---|---|---|
| 2024 | $2,211 | $57,339 | $4,268 | $53,071 |
| 2023 | $2,031 | $55,183 | $3,880 | $51,303 |
| 2022 | $1,646 | $45,118 | $3,104 | $42,014 |
| 2021 | $1,385 | $37,314 | $3,104 | $34,210 |
| 2020 | $128 | $3,425 | $2,425 | $1,000 |
| 2019 | $127 | $3,425 | $2,425 | $1,000 |
| 2018 | $127 | $3,425 | $2,425 | $1,000 |
| 2017 | $127 | $3,425 | $2,425 | $1,000 |
| 2016 | $141 | $3,800 | $2,800 | $1,000 |
| 2015 | -- | $3,800 | $2,800 | $1,000 |
| 2014 | -- | $3,800 | $2,800 | $1,000 |
Source: Public Records
Map
Nearby Homes
- 515 S Broad St SW
- 115 Lookout Cir SW
- 113 Lookout Cir SW
- 515 Harper Ave SW
- 107 Butler St SW
- 111 Lookout Cir SW
- 232 S Broad St SW
- 3 Grover St SW
- 110 Cherokee St SW
- 235 Pennington Ave SW
- 105 Mary St SW
- 334 Branham Ave SW
- 529 Branham Ave SW
- 515 Hardy Ave SW
- 410 Hardy Ave SW
- 3 Porter St SW
- 5 Jervis St SW
- 13 N Blanche Ave SW
- 8 Butler St SW Unit B
- 10 Butler St SW
- 6 Butler St SW Unit 4
- 6 Butler St SW
- 8 Butler St
- 4 Butler St SW
- 9 McGhee St SW
- 14 Butler St SW
- 7 Butler St SW
- 13 McGhee St SW
- 9 Butler St SW
- 420 Broad St
- 5 McGhee St SW
- 11 Butler St SW
- 16 Butler St SW
- 15 McGhee St SW
- 13 Butler St SW
- 0 McGhee St SW Unit 7086384
- 0 McGhee St SW Unit 8656713
- 0 McGhee St SW Unit 8466014