8N369 Corron Rd Elgin, IL 60124
Bowes NeighborhoodEstimated Value: $532,000 - $639,000
4
Beds
2
Baths
2,282
Sq Ft
$250/Sq Ft
Est. Value
About This Home
This home is located at 8N369 Corron Rd, Elgin, IL 60124 and is currently estimated at $571,323, approximately $250 per square foot. 8N369 Corron Rd is a home located in Kane County with nearby schools including Howard B. Thomas Grade School, Prairie Knolls Middle School, and Central Middle School.
Ownership History
Date
Name
Owned For
Owner Type
Purchase Details
Closed on
Feb 10, 2025
Sold by
Wuestenberg Randal and Wuestenberg Carrie L
Bought by
Wuestenberg Revocable Trust and Wuestenberg
Current Estimated Value
Purchase Details
Closed on
Oct 26, 1995
Sold by
Burke Thomas J and Burke Joan M
Bought by
Wuestenberg Randal L and Wuestenberg Carrie L
Home Financials for this Owner
Home Financials are based on the most recent Mortgage that was taken out on this home.
Original Mortgage
$80,000
Interest Rate
7.61%
Purchase Details
Closed on
Sep 1, 1994
Sold by
Olesen William L and Olesen Frieda R
Bought by
Burke Thomas J and Burke Joan M
Home Financials for this Owner
Home Financials are based on the most recent Mortgage that was taken out on this home.
Original Mortgage
$230,000
Interest Rate
8.59%
Create a Home Valuation Report for This Property
The Home Valuation Report is an in-depth analysis detailing your home's value as well as a comparison with similar homes in the area
Home Values in the Area
Average Home Value in this Area
Purchase History
| Date | Buyer | Sale Price | Title Company |
|---|---|---|---|
| Wuestenberg Revocable Trust | -- | None Listed On Document | |
| Wuestenberg Randal L | $300,000 | -- | |
| Burke Thomas J | $230,000 | -- |
Source: Public Records
Mortgage History
| Date | Status | Borrower | Loan Amount |
|---|---|---|---|
| Previous Owner | Wuestenberg Randal L | $80,000 | |
| Previous Owner | Burke Thomas J | $230,000 |
Source: Public Records
Tax History
| Year | Tax Paid | Tax Assessment Tax Assessment Total Assessment is a certain percentage of the fair market value that is determined by local assessors to be the total taxable value of land and additions on the property. | Land | Improvement |
|---|---|---|---|---|
| 2024 | $11,235 | $159,675 | $40,535 | $119,140 |
| 2023 | $10,267 | $138,559 | $36,667 | $101,892 |
| 2022 | $10,913 | $137,147 | $35,595 | $101,552 |
| 2021 | $10,831 | $127,824 | $34,388 | $93,436 |
| 2020 | $10,802 | $125,527 | $33,770 | $91,757 |
| 2019 | $10,810 | $123,904 | $33,333 | $90,571 |
| 2018 | $10,012 | $115,816 | $34,200 | $81,616 |
| 2017 | $10,650 | $123,970 | $33,569 | $90,401 |
| 2016 | $11,283 | $121,029 | $32,773 | $88,256 |
| 2015 | -- | $112,139 | $32,773 | $79,366 |
| 2014 | -- | $112,139 | $32,773 | $79,366 |
| 2013 | -- | $114,055 | $33,333 | $80,722 |
Source: Public Records
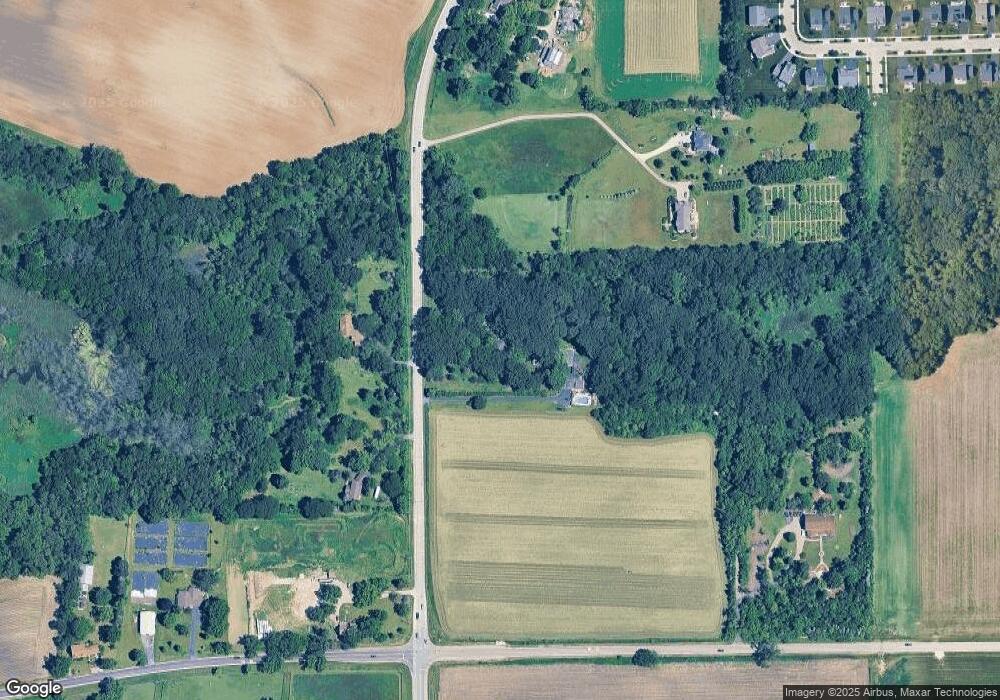
Map
Nearby Homes
- 3660 Thornhill Dr
- 3587 Sandstone Cir
- 3620 Sahara Rd
- 1846 Chandolin Ln
- 1850 Chandolin Ln
- 1848 Chandolin Ln
- 1842 Coralito Ln
- 1851 Diamond Dr
- 1847 Diamond Dr
- 1858 Chandolin Ln
- 1854 Chandolin Ln
- 1867 Chandolin Ln
- 1865 Chandolin Ln
- 1863 Chandolin Ln
- 1857 Chandolin Ln
- 1853 Chandolin Ln
- 3591 Sandstone Cir
- 3588 Sandstone Cir
- 3590 Sandstone Cir
- 3553 Doral Dr
- 8N345 Corron Rd
- 1 Corron Rd
- 8N382 Corron Rd
- 8N260 Corron Rd
- Lot 1 Corron Rd
- 8N445 Corron Rd
- 1700 Corron Rd
- 8N457 Corron Rd
- 8N567 Corron Rd
- 40W332 McDonald Rd
- 3681 Thornhill Dr
- 3683 Thornhill Dr
- 3679 Thornhill Dr
- 40 McDonald Rd
- 3685 Thornhill Dr
- 3677 Thornhill Dr
- 3687 Thornhill Dr
- 40W622 McDonald Rd
- 3680 Thornhill Dr
- 3674 Thornhill Dr
Your Personal Tour Guide
Ask me questions while you tour the home.