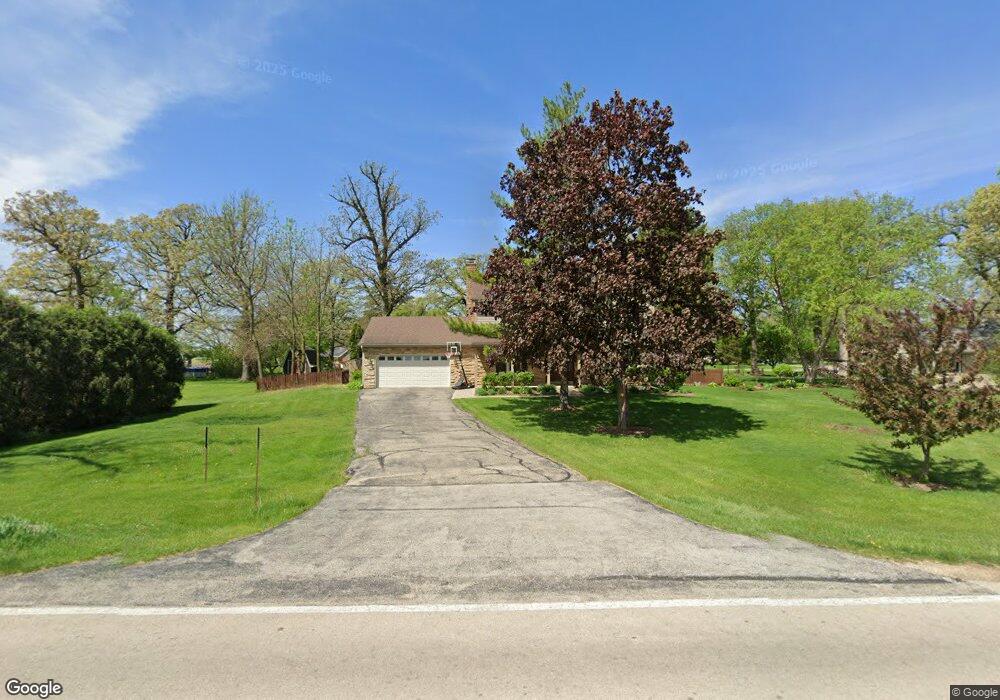
8S890 Dugan Rd Big Rock, IL 60511
Estimated Value: $391,000 - $406,262
3
Beds
3
Baths
2,040
Sq Ft
$196/Sq Ft
Est. Value
About This Home
This home is located at 8S890 Dugan Rd, Big Rock, IL 60511 and is currently estimated at $400,316, approximately $196 per square foot. 8S890 Dugan Rd is a home located in Kane County with nearby schools including Hinckley-Big Rock Elementary School and Hinckley-Big Rock High School.
Ownership History
Date
Name
Owned For
Owner Type
Purchase Details
Closed on
Jul 22, 2019
Sold by
Mau Patricia A and Mau Robert C
Bought by
Mcginnis Matthew and Mcginnis Heather
Current Estimated Value
Home Financials for this Owner
Home Financials are based on the most recent Mortgage that was taken out on this home.
Original Mortgage
$207,247
Outstanding Balance
$182,233
Interest Rate
4%
Mortgage Type
New Conventional
Estimated Equity
$218,083
Purchase Details
Closed on
Mar 5, 2012
Sold by
Mau Robert C and Mau Patricia A
Bought by
Mau Patricia A
Purchase Details
Closed on
Jun 5, 1996
Sold by
Bank One Chicago Na
Bought by
Mau Robert C and Mau Patricia A
Home Financials for this Owner
Home Financials are based on the most recent Mortgage that was taken out on this home.
Original Mortgage
$125,000
Interest Rate
8.05%
Mortgage Type
Balloon
Create a Home Valuation Report for This Property
The Home Valuation Report is an in-depth analysis detailing your home's value as well as a comparison with similar homes in the area
Home Values in the Area
Average Home Value in this Area
Purchase History
| Date | Buyer | Sale Price | Title Company |
|---|---|---|---|
| Mcginnis Matthew | $244,000 | Attorney | |
| Mau Patricia A | -- | None Available | |
| Mau Robert C | $163,000 | Attorneys Title Guaranty Fun |
Source: Public Records
Mortgage History
| Date | Status | Borrower | Loan Amount |
|---|---|---|---|
| Open | Mcginnis Matthew | $207,247 | |
| Previous Owner | Mau Robert C | $125,000 |
Source: Public Records
Tax History Compared to Growth
Tax History
| Year | Tax Paid | Tax Assessment Tax Assessment Total Assessment is a certain percentage of the fair market value that is determined by local assessors to be the total taxable value of land and additions on the property. | Land | Improvement |
|---|---|---|---|---|
| 2024 | $7,705 | $120,729 | $26,835 | $93,894 |
| 2023 | $7,409 | $111,415 | $24,765 | $86,650 |
| 2022 | $7,196 | $104,527 | $23,234 | $81,293 |
| 2021 | $7,342 | $98,221 | $21,832 | $76,389 |
| 2020 | $7,199 | $94,863 | $21,086 | $73,777 |
| 2019 | $6,903 | $90,166 | $20,042 | $70,124 |
| 2018 | $6,750 | $83,858 | $19,321 | $64,537 |
| 2017 | $6,518 | $79,306 | $18,272 | $61,034 |
| 2016 | $6,382 | $74,671 | $18,272 | $56,399 |
| 2015 | -- | $70,320 | $17,975 | $52,345 |
| 2014 | -- | $67,997 | $17,975 | $50,022 |
| 2013 | -- | $70,587 | $18,481 | $52,106 |
Source: Public Records
Map
Nearby Homes
- 45W127 Jericho Rd
- 1650 Highway 30
- 240 Snow St
- 92 Maple St
- 126 S Sugar Grove Pkwy
- 191 Meadows Dr
- 389 Mallard Ln
- 369 Mallard Ln
- 171 Willoughby Ct Unit E
- 4568 Garritano St Unit A
- 110 S Sugar Grove Pkwy
- 181 Willoughby Ct Unit B
- 4555 Camden Ln Unit C
- 4566 Camden Ln Unit D
- 4579 Half Moon Dr Unit A
- 4574 Half Moon Dr Unit C
- 73 Neil Rd
- 124 Bertram Dr Unit M
- 206 Burnett St
- 226 W Park Ave Unit A
- 8S918 Dugan Rd
- 8S870 Dugan Rd
- 8S885 Oaken Dr
- 8S905 Oaken Dr
- 8S790 Dugan Rd
- 8S840 Dugan Rd
- 8S860 Toronto St
- 8S845 Toronto St
- 8S899 Oaken Dr
- 8S816 Dugan Rd
- 8S815 Toronto St
- 8S830 Toronto St
- 8S818 Toronto St
- 8S791 Toronto St
- 8S800 Toronto St
- 8S755 Toronto St
- 8S738 Dugan Rd
- 45W121 Raymond Rd
- 45W104 Raymond Rd
- 45W131 Jericho Rd