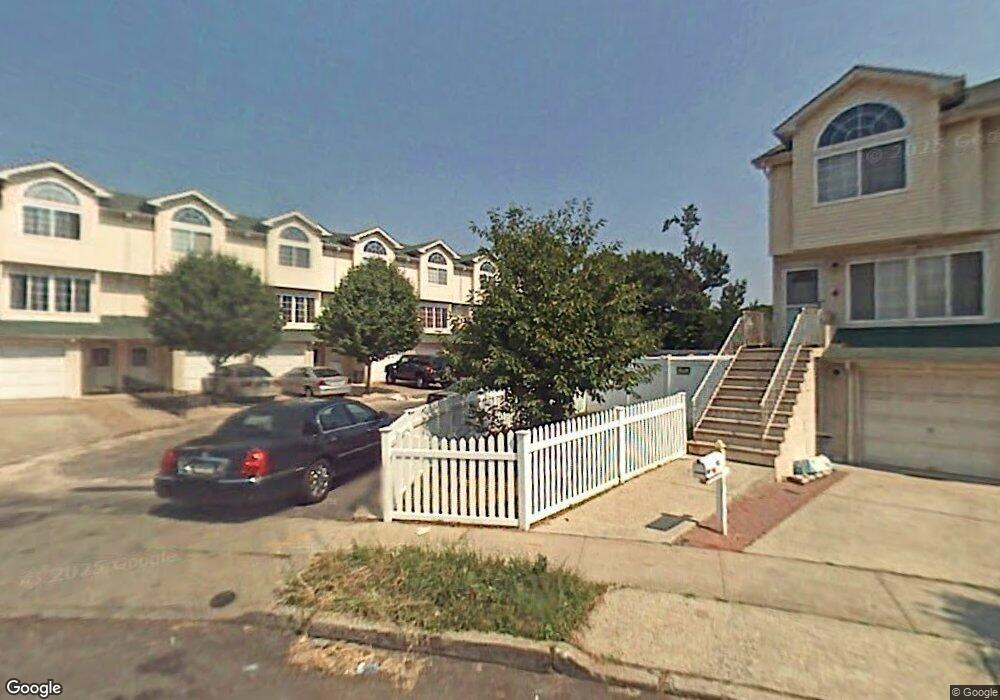
9-11 Ludwig Ln Staten Island, NY 10303
Graniteville NeighborhoodEstimated Value: $623,603 - $719,000
--
Bed
4
Baths
1,800
Sq Ft
$370/Sq Ft
Est. Value
About This Home
This home is located at 9-11 Ludwig Ln, Staten Island, NY 10303 and is currently estimated at $666,651, approximately $370 per square foot. 9-11 Ludwig Ln is a home located in Richmond County with nearby schools including P.S. 22 Graniteville, I.S. 51 Edwin Markham, and Port Richmond High School.
Ownership History
Date
Name
Owned For
Owner Type
Purchase Details
Closed on
Dec 17, 2020
Sold by
Williams Chanze E and Williams Natasha
Bought by
In Vuthy
Current Estimated Value
Home Financials for this Owner
Home Financials are based on the most recent Mortgage that was taken out on this home.
Original Mortgage
$557,535
Outstanding Balance
$496,461
Interest Rate
2.71%
Mortgage Type
VA
Estimated Equity
$170,190
Purchase Details
Closed on
Aug 23, 2018
Sold by
Nilsen Ralph and Nilsen Helene
Bought by
Williams Chanze E and Williams Natasha
Purchase Details
Closed on
Jan 20, 2000
Sold by
Passarelli Guido
Bought by
Nilsen Ralph and Nilsen Helene
Home Financials for this Owner
Home Financials are based on the most recent Mortgage that was taken out on this home.
Original Mortgage
$166,270
Interest Rate
8.31%
Create a Home Valuation Report for This Property
The Home Valuation Report is an in-depth analysis detailing your home's value as well as a comparison with similar homes in the area
Home Values in the Area
Average Home Value in this Area
Purchase History
| Date | Buyer | Sale Price | Title Company |
|---|---|---|---|
| In Vuthy | $545,000 | None Listed On Document | |
| Williams Chanze E | $495,000 | None Available | |
| Nilsen Ralph | $189,000 | Old Republic Natl Title Ins |
Source: Public Records
Mortgage History
| Date | Status | Borrower | Loan Amount |
|---|---|---|---|
| Open | In Vuthy | $557,535 | |
| Previous Owner | Nilsen Ralph | $166,270 |
Source: Public Records
Tax History Compared to Growth
Tax History
| Year | Tax Paid | Tax Assessment Tax Assessment Total Assessment is a certain percentage of the fair market value that is determined by local assessors to be the total taxable value of land and additions on the property. | Land | Improvement |
|---|---|---|---|---|
| 2025 | $5,970 | $38,940 | $7,511 | $31,429 |
| 2024 | $5,970 | $36,900 | $7,926 | $28,974 |
| 2023 | $5,700 | $28,067 | $6,671 | $21,396 |
| 2022 | $5,286 | $34,200 | $9,840 | $24,360 |
| 2021 | $5,257 | $30,540 | $9,840 | $20,700 |
| 2020 | $4,947 | $29,580 | $9,840 | $19,740 |
| 2019 | $4,888 | $29,520 | $9,840 | $19,680 |
| 2018 | $4,470 | $23,389 | $9,471 | $13,918 |
| 2017 | $4,198 | $22,066 | $8,515 | $13,551 |
| 2016 | $3,852 | $20,818 | $8,409 | $12,409 |
| 2015 | -- | $20,640 | $8,220 | $12,420 |
| 2014 | -- | $20,640 | $8,220 | $12,420 |
Source: Public Records
Map
Nearby Homes
- 5 Ludwig Ln Unit B
- 15 Ludwig Ln
- 33 Ludwig Ln
- 37 Ludwig Ln
- 51 Adrianne Ln
- 48 Adrianne Ln
- 38 Eleanor Place
- 49 Doreen Dr
- 25 Claudia Ct
- 21 Carol Place
- 151 Amity Place
- 123 Amity Place
- 414 Wilcox St
- 66 Jules Dr
- 268 Bruckner Ave Unit 268
- 61 Comstock Ave
- 12 Regis Dr Unit 79
- 58 Selvin Loop Unit 153
- 62 Comstock Ave
- 32 Amador St
- 9 Ludwig Ln Unit 11
- 11 Ludwig Ln Unit 13
- 11-13 Ludwig Ln
- 17 Ludwig Ln
- 19 Ludwig Ln
- 7C Ludwig Ln
- 7C17 Ludwig Ln
- 80 Adrianne Ln
- 21 Ludwig Ln
- 23 Ludwig Ln
- 7B Ludwig Ln
- 7B15 Ludwig Ln
- 78 Adrianne Ln
- 7 Ludwig Ln Unit C
- 7 Ludwig Ln Unit A
- 7A11 Ludwig Ln
- 10 Benjamin Dr
- 25 Ludwig Ln
- 76 Adrianne Ln
- 5B9 Ludwig Ln