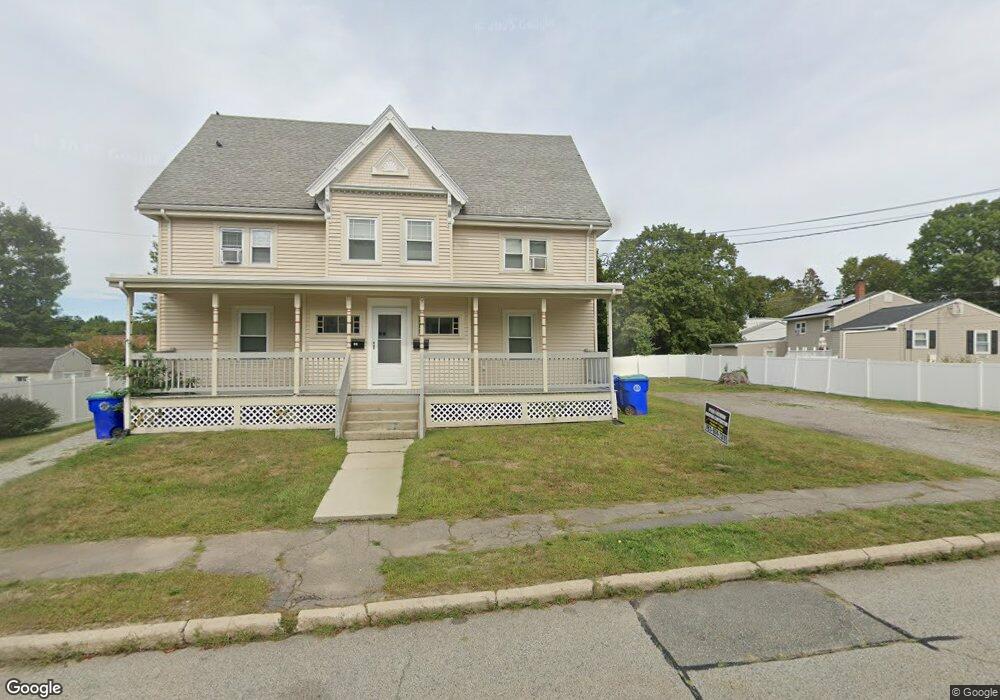
9-11 Maple St Rockland, MA 02370
Estimated Value: $696,558 - $745,000
6
Beds
2
Baths
3,000
Sq Ft
$243/Sq Ft
Est. Value
About This Home
This home is located at 9-11 Maple St, Rockland, MA 02370 and is currently estimated at $727,890, approximately $242 per square foot. 9-11 Maple St is a home located in Plymouth County with nearby schools including Rockland Senior High School, Calvary Chapel Academy, and St Bridget School.
Ownership History
Date
Name
Owned For
Owner Type
Purchase Details
Closed on
Jan 20, 2022
Sold by
Mcdonough Stephen and Mcdonough Mary T
Bought by
Coye Stephen J and Coye Kelly A
Current Estimated Value
Home Financials for this Owner
Home Financials are based on the most recent Mortgage that was taken out on this home.
Original Mortgage
$420,000
Outstanding Balance
$387,082
Interest Rate
3.11%
Mortgage Type
Purchase Money Mortgage
Estimated Equity
$340,808
Purchase Details
Closed on
May 13, 2009
Sold by
Cummings Robert O and Cummings Orrin R
Bought by
Mcdonough Stephen
Create a Home Valuation Report for This Property
The Home Valuation Report is an in-depth analysis detailing your home's value as well as a comparison with similar homes in the area
Home Values in the Area
Average Home Value in this Area
Purchase History
| Date | Buyer | Sale Price | Title Company |
|---|---|---|---|
| Coye Stephen J | $560,000 | None Available | |
| Mcdonough Stephen | $215,000 | -- |
Source: Public Records
Mortgage History
| Date | Status | Borrower | Loan Amount |
|---|---|---|---|
| Open | Coye Stephen J | $420,000 | |
| Previous Owner | Mcdonough Stephen | $20,000 |
Source: Public Records
Tax History Compared to Growth
Tax History
| Year | Tax Paid | Tax Assessment Tax Assessment Total Assessment is a certain percentage of the fair market value that is determined by local assessors to be the total taxable value of land and additions on the property. | Land | Improvement |
|---|---|---|---|---|
| 2025 | $9,226 | $674,900 | $230,800 | $444,100 |
| 2024 | $8,956 | $637,000 | $217,800 | $419,200 |
| 2023 | $9,280 | $609,700 | $189,800 | $419,900 |
| 2022 | $8,886 | $530,500 | $165,000 | $365,500 |
| 2021 | $8,089 | $468,100 | $150,000 | $318,100 |
| 2020 | $7,803 | $445,900 | $142,900 | $303,000 |
| 2019 | $7,297 | $407,200 | $136,100 | $271,100 |
| 2018 | $6,924 | $380,000 | $136,100 | $243,900 |
| 2017 | $6,485 | $350,900 | $128,900 | $222,000 |
| 2016 | $6,242 | $337,600 | $124,000 | $213,600 |
| 2015 | $6,249 | $328,400 | $115,900 | $212,500 |
| 2014 | $5,795 | $316,000 | $113,600 | $202,400 |
Source: Public Records
Map
Nearby Homes
- 103 Grove St Unit 337
- 119 Grove St Unit 223
- 119 Grove St Unit 238
- 225 W Water St
- 23 Payson Ave
- 122 Reed St
- 94-96 Crescent St
- 45-47 Park St
- 5 Clark Rd
- 5 Florence St
- 6 Chestnut Cir
- 59 Spring St
- 44 Albion St
- 15 Thayer Terrace
- 1 Canterbury Ln
- 149 Concord St
- 20 Birch St
- 17-23 Dyer St Unit 17
- 11 Dyer St Unit 11
- 13 Dyer St Unit 13