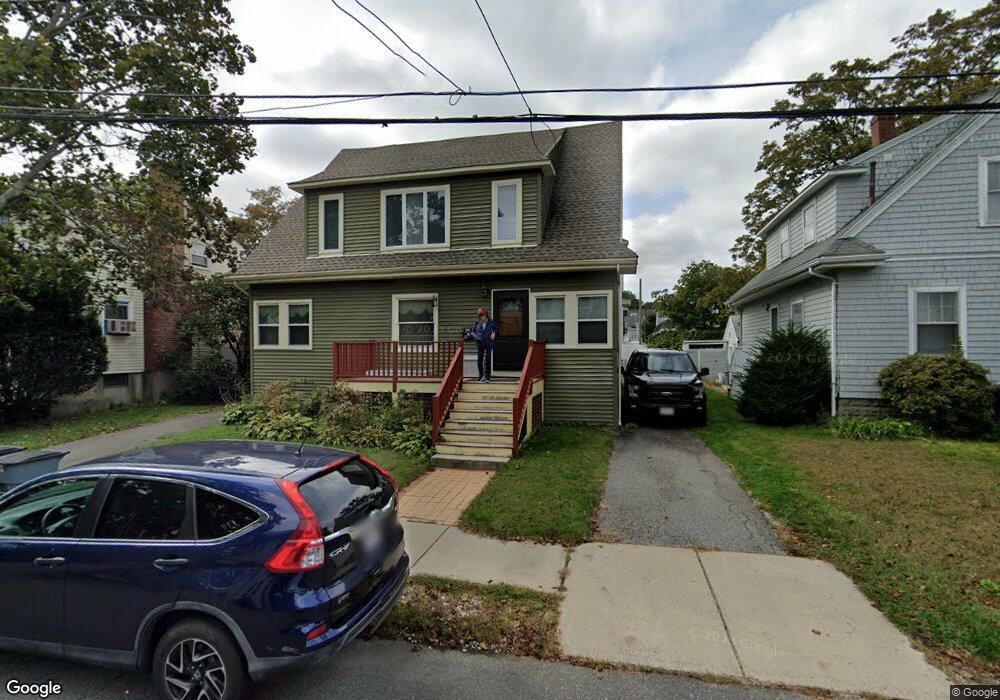
9-11 Parkway Rd Stoneham, MA 02180
Haywardville NeighborhoodEstimated Value: $781,000 - $847,220
4
Beds
2
Baths
2,086
Sq Ft
$389/Sq Ft
Est. Value
About This Home
This home is located at 9-11 Parkway Rd, Stoneham, MA 02180 and is currently estimated at $810,555, approximately $388 per square foot. 9-11 Parkway Rd is a home located in Middlesex County with nearby schools including Stoneham High School, Greater Boston Academy, and St. Patrick Elementary School.
Ownership History
Date
Name
Owned For
Owner Type
Purchase Details
Closed on
Apr 22, 2014
Sold by
Roberts Karen M and Babine Karen M
Bought by
Roberts Stephen E and Roberts Karen M
Current Estimated Value
Home Financials for this Owner
Home Financials are based on the most recent Mortgage that was taken out on this home.
Original Mortgage
$344,000
Outstanding Balance
$260,714
Interest Rate
4.26%
Mortgage Type
New Conventional
Estimated Equity
$549,841
Purchase Details
Closed on
Oct 27, 1998
Sold by
Durgin Harold L
Bought by
Babine Karen and Carmody Helen L
Home Financials for this Owner
Home Financials are based on the most recent Mortgage that was taken out on this home.
Original Mortgage
$209,000
Interest Rate
6.74%
Mortgage Type
Purchase Money Mortgage
Create a Home Valuation Report for This Property
The Home Valuation Report is an in-depth analysis detailing your home's value as well as a comparison with similar homes in the area
Home Values in the Area
Average Home Value in this Area
Purchase History
| Date | Buyer | Sale Price | Title Company |
|---|---|---|---|
| Roberts Stephen E | -- | -- | |
| Babine Karen | $220,000 | -- |
Source: Public Records
Mortgage History
| Date | Status | Borrower | Loan Amount |
|---|---|---|---|
| Open | Roberts Stephen E | $344,000 | |
| Previous Owner | Babine Karen | $227,789 | |
| Previous Owner | Babine Karen | $209,000 |
Source: Public Records
Tax History Compared to Growth
Tax History
| Year | Tax Paid | Tax Assessment Tax Assessment Total Assessment is a certain percentage of the fair market value that is determined by local assessors to be the total taxable value of land and additions on the property. | Land | Improvement |
|---|---|---|---|---|
| 2025 | $7,253 | $709,000 | $332,500 | $376,500 |
| 2024 | $7,231 | $682,800 | $306,300 | $376,500 |
| 2023 | $7,287 | $656,500 | $280,000 | $376,500 |
| 2022 | $6,471 | $621,600 | $253,800 | $367,800 |
| 2021 | $6,436 | $594,800 | $245,000 | $349,800 |
| 2020 | $6,056 | $561,300 | $229,500 | $331,800 |
| 2019 | $5,868 | $523,000 | $225,000 | $298,000 |
| 2018 | $5,734 | $489,700 | $195,500 | $294,200 |
| 2017 | $5,279 | $426,100 | $176,000 | $250,100 |
| 2016 | $5,198 | $409,300 | $176,000 | $233,300 |
| 2015 | $5,109 | $394,200 | $168,000 | $226,200 |
| 2014 | $4,976 | $368,900 | $160,000 | $208,900 |
Source: Public Records
Map
Nearby Homes
- 588 Main St Unit 3C
- 5 Rockville Park
- 25 Murdoch Rd
- 5-9 Rockville Park
- 222 Park St
- 8 Walnut St
- 34 Warren St Unit 3
- 137 Franklin St Unit 102
- 137 Franklin St Unit 404
- 17 Franklin St
- 159 Franklin St Unit C2
- 17A 17 B Emerson
- 17 Emerson St Unit A
- 5 Sheffield Rd
- 2 Stratton Dr Unit 1109
- 2 Archer Dr Unit 1
- 10 Mason Way Unit 61
- 2 Mason Way Unit 6524
- 6 Mason Way Unit 6324
- 19 Mason Way Unit 75
- 9 Parkway Rd Unit 11
- 15 Parkway Rd
- 7 Wilson Rd
- 19 Parkway Rd
- 602 Main St Unit 604
- 602 Main St Unit 602
- 604 Main St Unit 604
- 604 Main St
- 602 Main St Unit 2
- 604 Main St Unit 1
- 600 Main St Unit 2
- 600 Main St Unit 1
- 10 Parkway Rd Unit 10
- 10 Parkway Rd Unit 12
- 10 Parkway Rd Unit 1
- 10 Parkway Rd
- 23 Parkway Rd
- 16 Parkway Rd
- 11 Wilson Rd
- 608 Main St