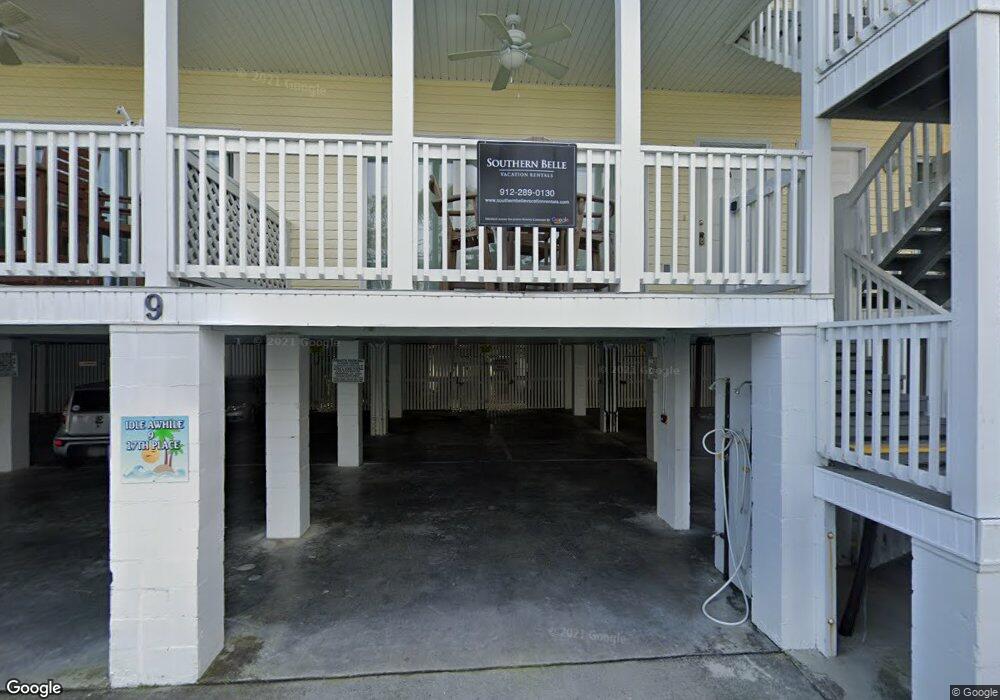
9 17th Place Unit 3A Tybee Island, GA 31328
Estimated Value: $421,000 - $429,000
2
Beds
2
Baths
1,008
Sq Ft
$421/Sq Ft
Est. Value
About This Home
This home is located at 9 17th Place Unit 3A, Tybee Island, GA 31328 and is currently estimated at $424,517, approximately $421 per square foot. 9 17th Place Unit 3A is a home located in Chatham County with nearby schools including Howard Elementary School, Coastal Middle School, and Islands High School.
Ownership History
Date
Name
Owned For
Owner Type
Purchase Details
Closed on
Apr 12, 2022
Sold by
Otoole Thomas
Bought by
Chen Sheng Mao
Current Estimated Value
Home Financials for this Owner
Home Financials are based on the most recent Mortgage that was taken out on this home.
Original Mortgage
$278,800
Outstanding Balance
$227,130
Interest Rate
3.39%
Mortgage Type
New Conventional
Estimated Equity
$197,387
Purchase Details
Closed on
Dec 29, 2009
Sold by
Federal Home Loan Mortgage Corporation
Bought by
Otoole Thomas
Home Financials for this Owner
Home Financials are based on the most recent Mortgage that was taken out on this home.
Original Mortgage
$168,000
Interest Rate
4.68%
Mortgage Type
Commercial
Purchase Details
Closed on
Feb 3, 2009
Sold by
Countrywide Home Loans
Bought by
Federal Home Loan Mortgage Corporation
Purchase Details
Closed on
Jun 30, 2006
Bought by
Otoole Thomas and Kathryn
Home Financials for this Owner
Home Financials are based on the most recent Mortgage that was taken out on this home.
Original Mortgage
$280,000
Interest Rate
6.88%
Mortgage Type
Commercial
Create a Home Valuation Report for This Property
The Home Valuation Report is an in-depth analysis detailing your home's value as well as a comparison with similar homes in the area
Home Values in the Area
Average Home Value in this Area
Purchase History
| Date | Buyer | Sale Price | Title Company |
|---|---|---|---|
| Chen Sheng Mao | $429,000 | -- | |
| Otoole Thomas | $210,000 | -- | |
| Federal Home Loan Mortgage Corporation | $293,782 | -- | |
| Countrywide Home Loans | $293,782 | -- | |
| Otoole Thomas | -- | -- |
Source: Public Records
Mortgage History
| Date | Status | Borrower | Loan Amount |
|---|---|---|---|
| Open | Chen Sheng Mao | $278,800 | |
| Previous Owner | Otoole Thomas | $168,000 | |
| Previous Owner | Otoole Thomas | $280,000 |
Source: Public Records
Tax History Compared to Growth
Tax History
| Year | Tax Paid | Tax Assessment Tax Assessment Total Assessment is a certain percentage of the fair market value that is determined by local assessors to be the total taxable value of land and additions on the property. | Land | Improvement |
|---|---|---|---|---|
| 2025 | $5,289 | $171,120 | $104,680 | $66,440 |
| 2024 | $5,289 | $170,040 | $104,680 | $65,360 |
| 2023 | $5,438 | $171,600 | $102,680 | $68,920 |
| 2022 | $3,026 | $121,600 | $64,680 | $56,920 |
| 2021 | $2,990 | $107,280 | $64,680 | $42,600 |
| 2020 | $3,006 | $106,840 | $64,680 | $42,160 |
| 2019 | $3,006 | $102,040 | $64,680 | $37,360 |
| 2018 | $3,259 | $101,120 | $64,680 | $36,440 |
| 2017 | $3,249 | $101,440 | $64,680 | $36,760 |
| 2016 | $3,249 | $100,840 | $64,680 | $36,160 |
| 2015 | $2,936 | $91,000 | $0 | $91,000 |
| 2014 | $4,217 | $88,360 | $0 | $0 |
Source: Public Records
Map
Nearby Homes
- 9 17th Place Unit 3A
- 8 18th St
- 5 17th Place Unit 2-A
- 9 Ts Chu Terrace
- 10 Ts Chu Terrace Unit 302
- 8 17th Place
- 3 17th St Unit 8
- 3 17th St Unit 2
- 1701 Strand Unit 8
- 1701 Strand Unit 2
- 5 17th St
- 1615 Strand Unit 4
- 12 Silver Ave Unit 303
- 8 Silver Ave Unit 9
- 1609 Strand Unit 107
- 1609 Strand Unit 306
- 18 Silver Ave Unit 4
- 18 Silver Ave Unit 10
- 18 Silver Ave Unit 1
- 13 Izlar Ave
- 9 17th Place
- 9 17th Place Unit 7A
- 9 17th Place Unit 5A
- 9 17th Place Unit 7B
- 9 17th Place Unit 2A
- 9 17th Place Unit 6B
- 9 17th Place Unit 1A
- 9 17th Place Unit 5-B
- 9 17th Place Unit 1B
- 17th Polk Ave Unit 5-B
- 12 18th St
- 12 18th St
- 14 18th St
- 14 18th St
- 16 18th St
- 10 17th Place
- 10 18th St
- 10 18th St
- 15 17th Place
- 15 17th Place