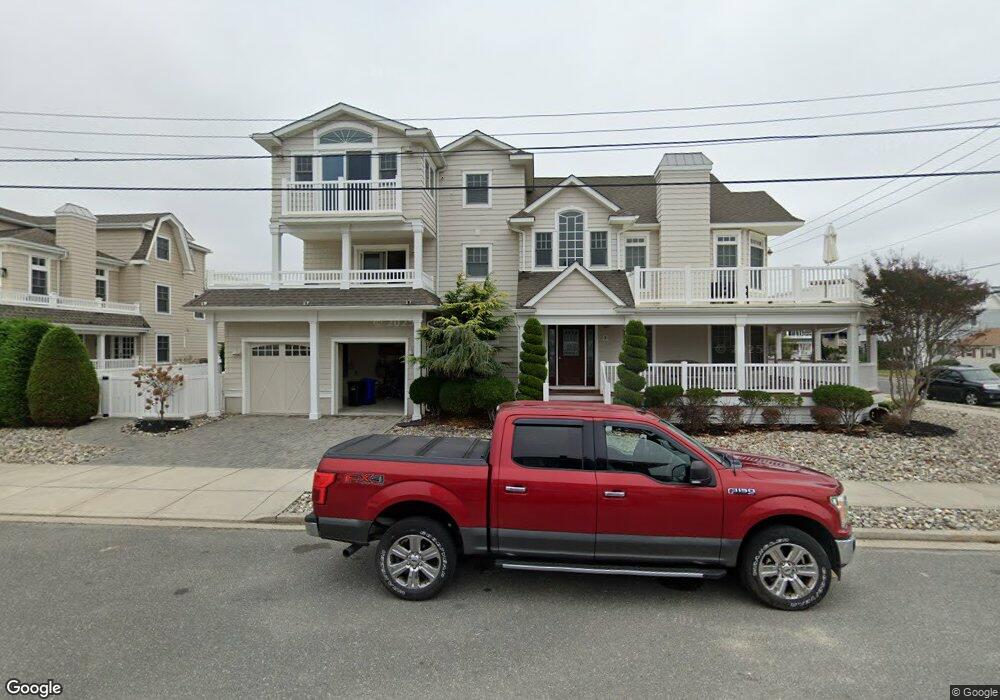
9 17th St W Avalon, NJ 08202
Estimated Value: $4,544,983 - $4,859,000
Studio
--
Bath
3,568
Sq Ft
$1,314/Sq Ft
Est. Value
About This Home
This home is located at 9 17th St W, Avalon, NJ 08202 and is currently estimated at $4,687,746, approximately $1,313 per square foot. 9 17th St W is a home located in Cape May County with nearby schools including Avalon Elementary School.
Ownership History
Date
Name
Owned For
Owner Type
Purchase Details
Closed on
Jan 15, 2026
Sold by
Simone Benjamin
Bought by
Simone Benjamin and Simone Toni C
Current Estimated Value
Purchase Details
Closed on
Apr 5, 2006
Sold by
Horan Robert A and Horan Eileen
Bought by
Simone Benjamin
Home Financials for this Owner
Home Financials are based on the most recent Mortgage that was taken out on this home.
Original Mortgage
$1,190,000
Interest Rate
6.37%
Mortgage Type
New Conventional
Purchase Details
Closed on
Apr 22, 1989
Sold by
Hanna Joseph and Hanna Diane
Bought by
Horan Robert and Horan Eileen
Create a Home Valuation Report for This Property
The Home Valuation Report is an in-depth analysis detailing your home's value as well as a comparison with similar homes in the area
Home Values in the Area
Average Home Value in this Area
Purchase History
| Date | Buyer | Sale Price | Title Company |
|---|---|---|---|
| Simone Benjamin | -- | None Listed On Document | |
| Simone Benjamin | $1,700,000 | None Available | |
| Horan Robert | $325,000 | -- |
Source: Public Records
Mortgage History
| Date | Status | Borrower | Loan Amount |
|---|---|---|---|
| Previous Owner | Simone Benjamin | $1,190,000 |
Source: Public Records
Tax History
| Year | Tax Paid | Tax Assessment Tax Assessment Total Assessment is a certain percentage of the fair market value that is determined by local assessors to be the total taxable value of land and additions on the property. | Land | Improvement |
|---|---|---|---|---|
| 2025 | $14,390 | $2,343,700 | $1,350,000 | $993,700 |
| 2024 | $14,390 | $2,343,700 | $1,350,000 | $993,700 |
| 2023 | $14,273 | $2,343,700 | $1,350,000 | $993,700 |
| 2022 | $13,312 | $2,343,700 | $1,350,000 | $993,700 |
| 2021 | $12,820 | $2,343,700 | $1,350,000 | $993,700 |
| 2020 | $12,328 | $2,343,700 | $1,350,000 | $993,700 |
| 2019 | $11,953 | $2,343,700 | $1,350,000 | $993,700 |
| 2018 | $11,437 | $2,343,700 | $1,350,000 | $993,700 |
| 2017 | $11,063 | $1,989,700 | $1,045,000 | $944,700 |
| 2016 | $10,943 | $1,989,700 | $1,045,000 | $944,700 |
| 2015 | $10,764 | $1,989,700 | $1,045,000 | $944,700 |
| 2014 | $10,645 | $1,989,700 | $1,045,000 | $944,700 |
Source: Public Records
Map
Nearby Homes
Your Personal Tour Guide
Ask me questions while you tour the home.