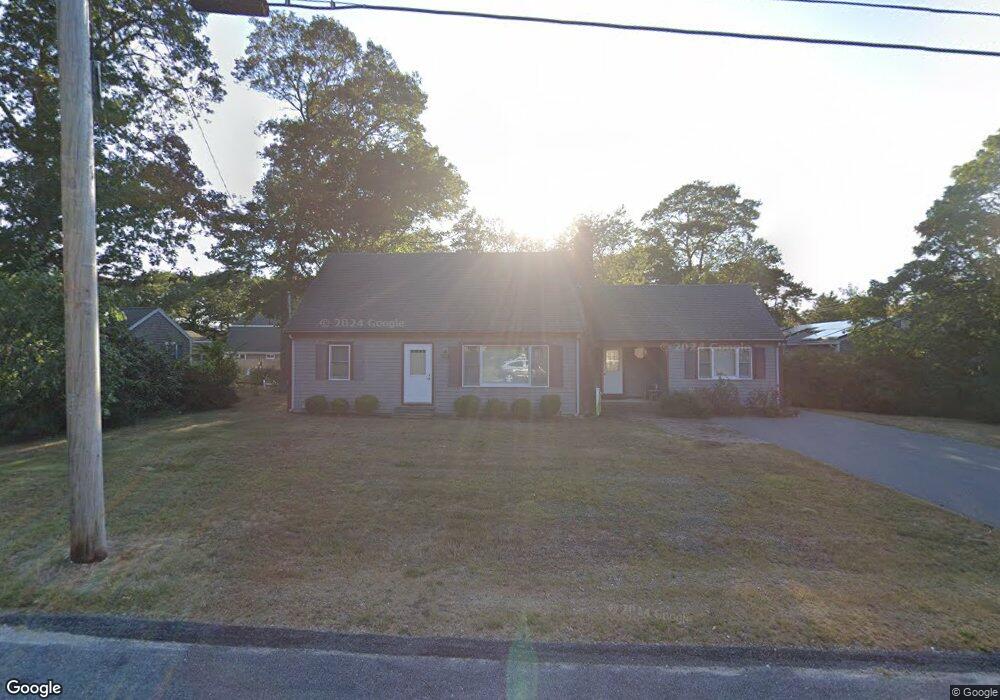
9 3rd Ave Barnstable, MA 02630
Estimated Value: $719,000 - $1,436,000
3
Beds
2
Baths
1,801
Sq Ft
$524/Sq Ft
Est. Value
About This Home
This home is located at 9 3rd Ave, Barnstable, MA 02630 and is currently estimated at $943,333, approximately $523 per square foot. 9 3rd Ave is a home located in Barnstable County with nearby schools including Hyannis West Elementary School, Barnstable United Elementary School, and Barnstable Intermediate School.
Ownership History
Date
Name
Owned For
Owner Type
Purchase Details
Closed on
May 15, 2002
Sold by
Cooney Thomas A and Cooney Pamela
Bought by
Sanpalis Valerie B and Sampalis Demetrius D
Current Estimated Value
Home Financials for this Owner
Home Financials are based on the most recent Mortgage that was taken out on this home.
Original Mortgage
$195,000
Outstanding Balance
$82,795
Interest Rate
7.15%
Mortgage Type
Purchase Money Mortgage
Estimated Equity
$860,538
Purchase Details
Closed on
Mar 29, 1999
Sold by
Parent Colleen
Bought by
Cooney Thomas A and Cooney Pamela
Home Financials for this Owner
Home Financials are based on the most recent Mortgage that was taken out on this home.
Original Mortgage
$108,000
Interest Rate
6.78%
Mortgage Type
Purchase Money Mortgage
Create a Home Valuation Report for This Property
The Home Valuation Report is an in-depth analysis detailing your home's value as well as a comparison with similar homes in the area
Home Values in the Area
Average Home Value in this Area
Purchase History
| Date | Buyer | Sale Price | Title Company |
|---|---|---|---|
| Sanpalis Valerie B | $265,000 | -- | |
| Cooney Thomas A | $135,000 | -- |
Source: Public Records
Mortgage History
| Date | Status | Borrower | Loan Amount |
|---|---|---|---|
| Open | Cooney Thomas A | $195,000 | |
| Previous Owner | Cooney Thomas A | $108,000 | |
| Previous Owner | Cooney Thomas A | $69,200 |
Source: Public Records
Tax History
| Year | Tax Paid | Tax Assessment Tax Assessment Total Assessment is a certain percentage of the fair market value that is determined by local assessors to be the total taxable value of land and additions on the property. | Land | Improvement |
|---|---|---|---|---|
| 2025 | $5,963 | $643,300 | $206,900 | $436,400 |
| 2024 | $5,560 | $614,400 | $206,900 | $407,500 |
| 2023 | $4,925 | $552,700 | $188,100 | $364,600 |
| 2022 | $5,019 | $433,800 | $129,400 | $304,400 |
| 2021 | $4,678 | $392,800 | $131,400 | $261,400 |
| 2020 | $4,678 | $379,400 | $131,400 | $248,000 |
| 2019 | $4,550 | $361,700 | $139,400 | $222,300 |
| 2018 | $4,337 | $352,600 | $162,400 | $190,200 |
| 2017 | $4,115 | $343,200 | $162,400 | $180,800 |
| 2016 | $4,048 | $345,100 | $164,300 | $180,800 |
| 2015 | $3,877 | $335,100 | $157,300 | $177,800 |
Source: Public Records
Map
Nearby Homes
- 140 6th Ave
- 260 Tobey Way
- 20 Sunset Terrace
- 36 Grouse Ln
- 33 Edgewood Rd
- 83 Peacock Dr
- 15 Glen Rd
- 780 Craigville Beach Rd Unit D-2
- 780 Craigville Beach Rd Unit 1
- 780 Craigville Beach Rd
- 14 Marston Ave
- 443 Elliott Rd
- 498 Elliott Rd
- 18 Mount Vernon Ave
- 135 W Main St Unit 7
- 290 Riverview Ln
- 576 Strawberry Hill Rd
- 855 W Main St Unit 7
- 1060 Craigville Beach Rd
- 180 Pond View Dr
Your Personal Tour Guide
Ask me questions while you tour the home.