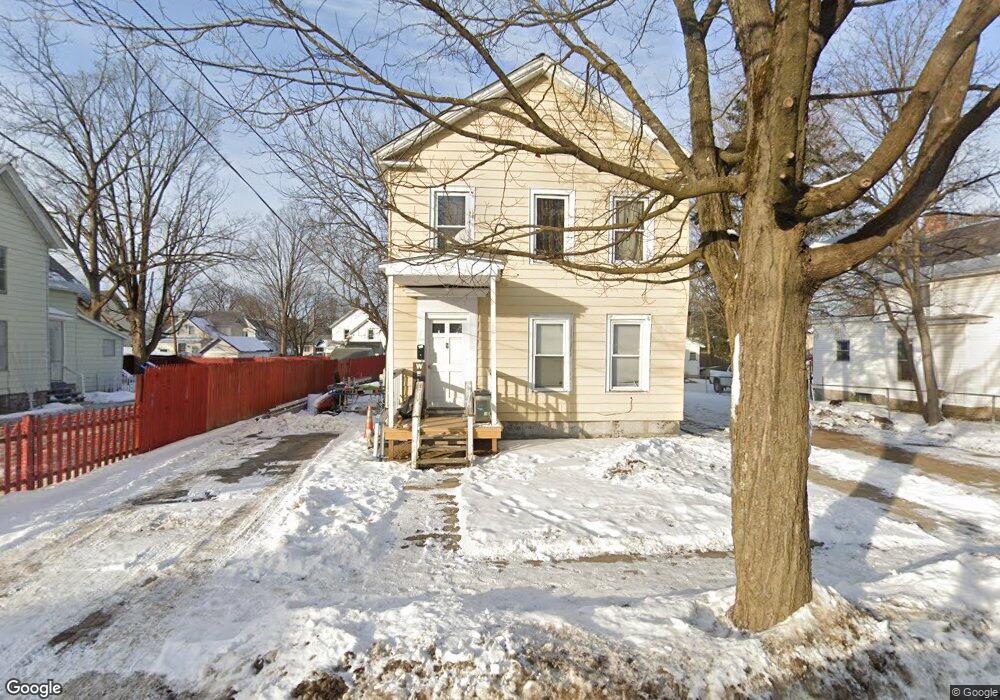
9 3rd St Glens Falls, NY 12801
Estimated Value: $182,000 - $243,000
3
Beds
1
Bath
1,345
Sq Ft
$157/Sq Ft
Est. Value
About This Home
This home is located at 9 3rd St, Glens Falls, NY 12801 and is currently estimated at $210,741, approximately $156 per square foot. 9 3rd St is a home located in Warren County with nearby schools including Glens Falls Senior High School and St. Mary's - St. Alphonsus Regional Catholic School.
Ownership History
Date
Name
Owned For
Owner Type
Purchase Details
Closed on
Nov 19, 2024
Sold by
Mathis Brian
Bought by
Main Street Housing Llc
Current Estimated Value
Home Financials for this Owner
Home Financials are based on the most recent Mortgage that was taken out on this home.
Original Mortgage
$191,250
Outstanding Balance
$188,463
Interest Rate
6.32%
Mortgage Type
New Conventional
Estimated Equity
$22,278
Purchase Details
Closed on
Oct 5, 2018
Sold by
Demers Raymond E
Bought by
Mathis Brian
Home Financials for this Owner
Home Financials are based on the most recent Mortgage that was taken out on this home.
Original Mortgage
$90,000
Interest Rate
4.5%
Mortgage Type
New Conventional
Purchase Details
Closed on
Dec 15, 1998
Purchase Details
Closed on
Oct 30, 1998
Create a Home Valuation Report for This Property
The Home Valuation Report is an in-depth analysis detailing your home's value as well as a comparison with similar homes in the area
Home Values in the Area
Average Home Value in this Area
Purchase History
| Date | Buyer | Sale Price | Title Company |
|---|---|---|---|
| Main Street Housing Llc | -- | None Available | |
| Main Street Housing Llc | -- | None Available | |
| Main Street Housing Llc | -- | None Available | |
| Mathis Brian | $100,000 | -- | |
| Mathis Brian | $100,000 | -- | |
| Mathis Brian | $100,000 | -- | |
| -- | $45,000 | -- | |
| -- | $45,000 | -- | |
| -- | $45,136 | -- | |
| -- | $45,136 | -- |
Source: Public Records
Mortgage History
| Date | Status | Borrower | Loan Amount |
|---|---|---|---|
| Open | Main Street Housing Llc | $191,250 | |
| Closed | Main Street Housing Llc | $191,250 | |
| Previous Owner | Mathis Brian | $90,000 |
Source: Public Records
Tax History
| Year | Tax Paid | Tax Assessment Tax Assessment Total Assessment is a certain percentage of the fair market value that is determined by local assessors to be the total taxable value of land and additions on the property. | Land | Improvement |
|---|---|---|---|---|
| 2024 | $3,672 | $132,300 | $30,000 | $102,300 |
| 2023 | $3,444 | $120,300 | $30,000 | $90,300 |
| 2022 | $4,033 | $120,300 | $30,000 | $90,300 |
| 2021 | $3,761 | $65,800 | $14,700 | $51,100 |
| 2020 | $3,705 | $65,800 | $14,700 | $51,100 |
| 2019 | $1,559 | $65,800 | $14,700 | $51,100 |
| 2018 | $1,559 | $65,800 | $14,700 | $51,100 |
| 2017 | $1,540 | $65,800 | $14,700 | $51,100 |
| 2016 | $2,746 | $65,800 | $14,700 | $51,100 |
| 2015 | -- | $65,800 | $14,700 | $51,100 |
| 2014 | -- | $65,800 | $14,700 | $51,100 |
Source: Public Records
Map
Nearby Homes
Your Personal Tour Guide
Ask me questions while you tour the home.