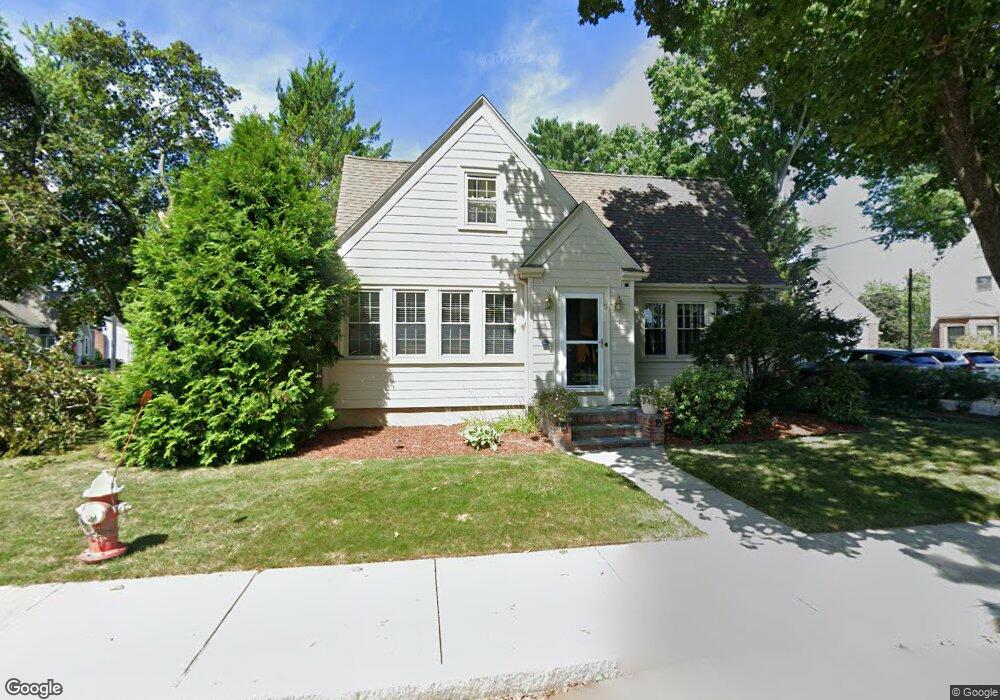
9 Adams St North Attleboro, MA 02760
North Attleboro NeighborhoodEstimated Value: $553,000 - $572,000
3
Beds
1
Bath
1,623
Sq Ft
$346/Sq Ft
Est. Value
About This Home
This home is located at 9 Adams St, North Attleboro, MA 02760 and is currently estimated at $562,321, approximately $346 per square foot. 9 Adams St is a home located in Bristol County with nearby schools including North Attleboro High School and Cadence Academy Preschool - North Attleborough.
Ownership History
Date
Name
Owned For
Owner Type
Purchase Details
Closed on
Feb 26, 2004
Sold by
Lord Christine M and Jacobs George J
Bought by
Tovar Mario
Current Estimated Value
Home Financials for this Owner
Home Financials are based on the most recent Mortgage that was taken out on this home.
Original Mortgage
$244,000
Outstanding Balance
$113,875
Interest Rate
5.65%
Mortgage Type
Purchase Money Mortgage
Estimated Equity
$448,446
Create a Home Valuation Report for This Property
The Home Valuation Report is an in-depth analysis detailing your home's value as well as a comparison with similar homes in the area
Home Values in the Area
Average Home Value in this Area
Purchase History
| Date | Buyer | Sale Price | Title Company |
|---|---|---|---|
| Tovar Mario | $305,000 | -- |
Source: Public Records
Mortgage History
| Date | Status | Borrower | Loan Amount |
|---|---|---|---|
| Open | Tovar Mario | $244,000 |
Source: Public Records
Tax History Compared to Growth
Tax History
| Year | Tax Paid | Tax Assessment Tax Assessment Total Assessment is a certain percentage of the fair market value that is determined by local assessors to be the total taxable value of land and additions on the property. | Land | Improvement |
|---|---|---|---|---|
| 2025 | $6,080 | $515,700 | $133,300 | $382,400 |
| 2024 | $5,769 | $499,900 | $133,300 | $366,600 |
| 2023 | $5,835 | $456,200 | $133,300 | $322,900 |
| 2022 | $5,395 | $387,300 | $133,300 | $254,000 |
| 2021 | $4,921 | $393,500 | $133,300 | $260,200 |
| 2020 | $5,460 | $380,500 | $133,300 | $247,200 |
| 2019 | $5,245 | $368,300 | $121,100 | $247,200 |
| 2018 | $4,653 | $348,800 | $121,100 | $227,700 |
| 2017 | $4,297 | $325,000 | $121,100 | $203,900 |
| 2016 | $4,360 | $329,800 | $134,600 | $195,200 |
| 2015 | $3,963 | $301,600 | $134,600 | $167,000 |
| 2014 | $3,719 | $280,900 | $118,200 | $162,700 |
Source: Public Records
Map
Nearby Homes
- 64 Smith St
- 20 South St
- 35-R Whiting St
- 68 Fisher St
- 8 Al Pace Dr Unit 8
- 45 Moran St
- 19 Church St Unit A5
- 212 Fisher St Unit A5
- 217 Fisher St
- 1066 Mount Hope St
- 16 Richards Ave Unit 106
- 85 Richards Ave
- 0 Landry 2nd Unit 73350867
- 880 Landry Ave Unit 2
- 16 Elizabeth St
- 93 Bank St
- 42 2nd Ave Unit 24
- 20 Holbrook Ave
- 99 Arnold Rd
- 58 Jay St