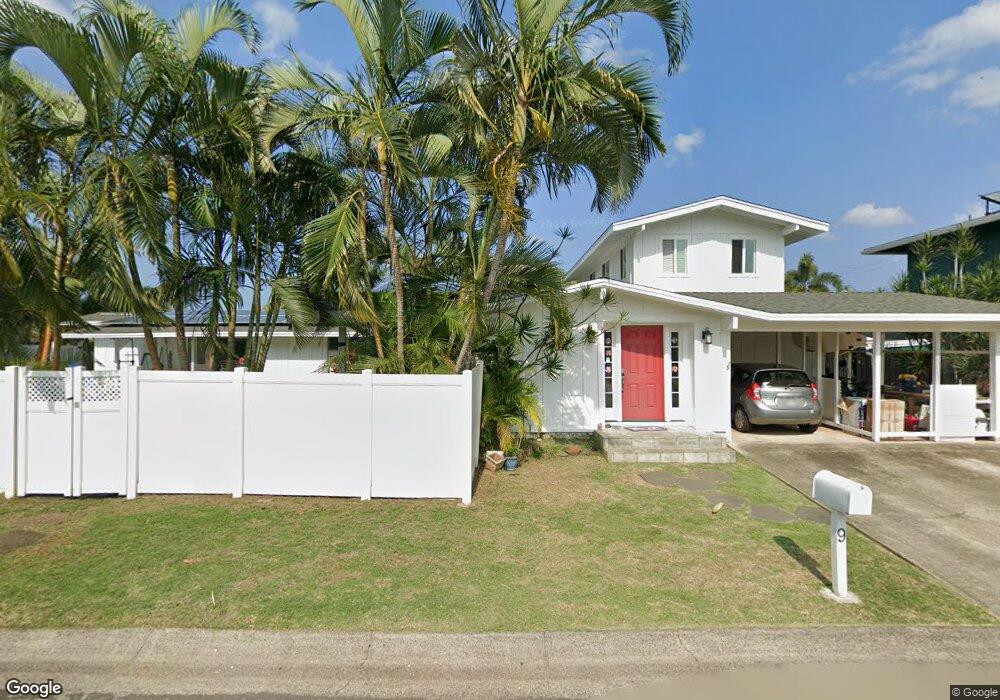
9 Aikahi Loop Kailua, HI 96734
Estimated Value: $1,619,000 - $2,637,935
4
Beds
4
Baths
3,111
Sq Ft
$676/Sq Ft
Est. Value
About This Home
This home is located at 9 Aikahi Loop, Kailua, HI 96734 and is currently estimated at $2,103,734, approximately $676 per square foot. 9 Aikahi Loop is a home located in Honolulu County with nearby schools including Aikahi Elementary School, Kailua Intermediate School, and Kalaheo High School.
Ownership History
Date
Name
Owned For
Owner Type
Purchase Details
Closed on
Jul 9, 2001
Sold by
Prout William Charles and Mcintye Audrey Kay
Bought by
Sommer John Tietjens and Sommer Jensin Weng
Current Estimated Value
Home Financials for this Owner
Home Financials are based on the most recent Mortgage that was taken out on this home.
Original Mortgage
$412,000
Outstanding Balance
$159,928
Interest Rate
7.24%
Estimated Equity
$1,943,806
Purchase Details
Closed on
Jun 9, 1999
Sold by
Bradley James H and Bradley Gwen W
Bought by
Prout William Charles and Mcintye Audrey Kay
Home Financials for this Owner
Home Financials are based on the most recent Mortgage that was taken out on this home.
Original Mortgage
$281,600
Interest Rate
7.01%
Purchase Details
Closed on
Oct 30, 1995
Sold by
Bradley James Harvey and Bradley Gwen Wong
Bought by
Bradley James H and Bradley Gwen W
Create a Home Valuation Report for This Property
The Home Valuation Report is an in-depth analysis detailing your home's value as well as a comparison with similar homes in the area
Home Values in the Area
Average Home Value in this Area
Purchase History
| Date | Buyer | Sale Price | Title Company |
|---|---|---|---|
| Sommer John Tietjens | $472,500 | -- | |
| Prout William Charles | $352,000 | Old Republic Title & Escrow | |
| Bradley James H | -- | -- |
Source: Public Records
Mortgage History
| Date | Status | Borrower | Loan Amount |
|---|---|---|---|
| Open | Sommer John Tietjens | $412,000 | |
| Previous Owner | Prout William Charles | $281,600 | |
| Closed | Prout William Charles | $52,800 |
Source: Public Records
Tax History
| Year | Tax Paid | Tax Assessment Tax Assessment Total Assessment is a certain percentage of the fair market value that is determined by local assessors to be the total taxable value of land and additions on the property. | Land | Improvement |
|---|---|---|---|---|
| 2025 | $4,971 | $1,569,400 | $1,317,800 | $251,600 |
| 2024 | $4,971 | $1,540,300 | $1,317,800 | $222,500 |
| 2023 | $5,221 | $1,691,800 | $1,317,800 | $374,000 |
| 2022 | $5,625 | $1,707,100 | $1,240,300 | $466,800 |
| 2021 | $4,636 | $1,424,600 | $1,023,200 | $401,400 |
| 2020 | $3,981 | $1,237,400 | $1,007,700 | $229,700 |
| 2019 | $4,184 | $1,275,500 | $992,200 | $283,300 |
| 2018 | $4,196 | $1,278,900 | $992,200 | $286,700 |
| 2017 | $3,972 | $1,214,800 | $868,200 | $346,600 |
| 2016 | $3,828 | $1,173,800 | $806,200 | $367,600 |
| 2015 | $3,034 | $946,800 | $697,700 | $249,100 |
| 2014 | -- | $861,200 | $666,700 | $194,500 |
Source: Public Records
Map
Nearby Homes
- 225 Aikane St
- 676 Mokapu Rd
- 304 Ilimano St
- 824 N Kalaheo Ave Unit A
- 592 Kaimalino St
- 610 Milokai St
- 3182 Kuau St Unit 702
- 316 Molo St Unit 1803
- 137 Oko St Unit 901
- 183 Oko St Unit 2604
- 1110 Ilikala Place
- 1251 Kainui Dr
- 572 C N Kalaheo Ave
- 661 N Kainalu Dr
- 508 N Kalaheo Ave
- 44-365 Nilu St Unit 109
- 44-361 Nilu St Unit 6
- 44-350 Olina St Unit 34
- 32 Pilipu Place Unit A
- 49 Pilipu Place
- 252 Aikahi Loop
- 3 Aikahi Loop
- 8 Aikahi Loop
- 753 Mokapu Rd
- 248 Aikahi Loop
- 17 Aikahi Loop
- 253 Aikahi Loop Unit A
- 4 Aikahi Loop
- 265 Aikahi Place
- 265 Aikahi Place Unit Upstairs
- 268 Aikahi Place
- 268 Aikahi Place Unit Ohana
- 249 Aikahi Loop
- 246 Aikahi Loop
- 749 Mokapu Rd
- 258 Aikane St
- 771 Mokapu Rd
- 771 Mokapu Rd Unit A
- 269 Aikahi Place
- 247 Aikahi Loop
Your Personal Tour Guide
Ask me questions while you tour the home.