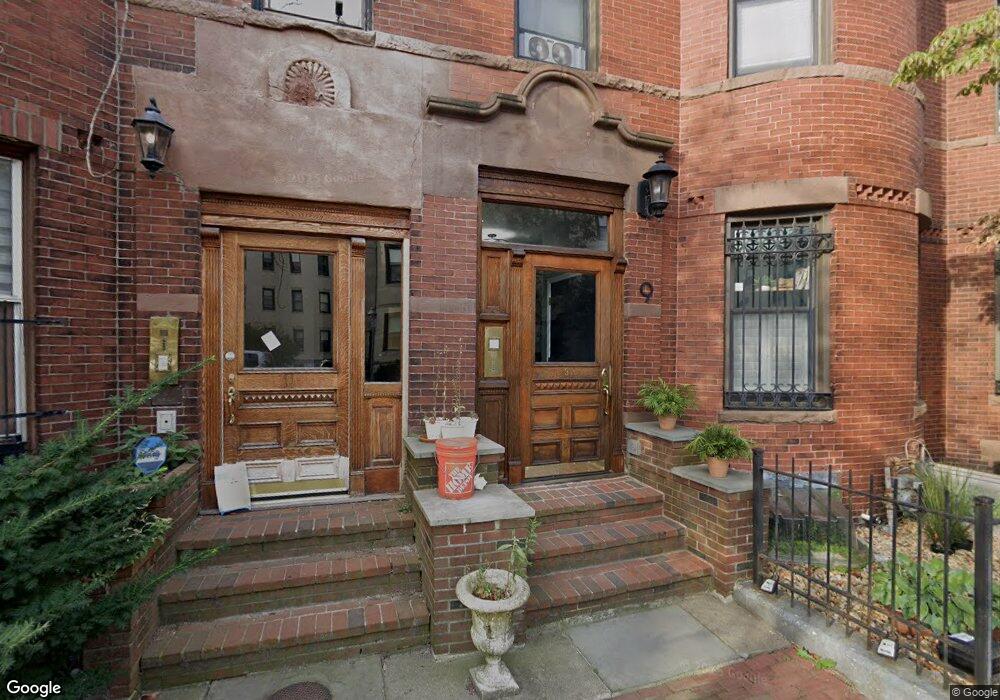
9 Albemarle St Unit 3 Boston, MA 02115
Back Bay NeighborhoodEstimated Value: $828,000 - $1,007,000
2
Beds
1
Bath
754
Sq Ft
$1,208/Sq Ft
Est. Value
About This Home
This home is located at 9 Albemarle St Unit 3, Boston, MA 02115 and is currently estimated at $910,945, approximately $1,208 per square foot. 9 Albemarle St Unit 3 is a home located in Suffolk County with nearby schools including Edward M. Kennedy Academy for Health Careers, Kingsley Montessori School, and The Newman School.
Ownership History
Date
Name
Owned For
Owner Type
Purchase Details
Closed on
Jul 2, 2010
Sold by
Manalili John and Manalili Barbara
Bought by
Parker Michael and Heller Jason
Current Estimated Value
Home Financials for this Owner
Home Financials are based on the most recent Mortgage that was taken out on this home.
Original Mortgage
$410,400
Interest Rate
4.88%
Mortgage Type
Purchase Money Mortgage
Purchase Details
Closed on
May 16, 2005
Sold by
Welch Bernard C
Bought by
Manalili Barbara and Manalili John
Home Financials for this Owner
Home Financials are based on the most recent Mortgage that was taken out on this home.
Original Mortgage
$355,200
Interest Rate
6.05%
Mortgage Type
Purchase Money Mortgage
Purchase Details
Closed on
Jan 18, 2005
Sold by
M&M Nt Rt and Toter Cynthia L
Bought by
Welch Bernard C and Pastoriza Celia
Home Financials for this Owner
Home Financials are based on the most recent Mortgage that was taken out on this home.
Original Mortgage
$310,500
Interest Rate
5.81%
Mortgage Type
Purchase Money Mortgage
Purchase Details
Closed on
Sep 30, 2004
Sold by
Ford John C
Bought by
M&M Nt and Katzeff Michael L
Create a Home Valuation Report for This Property
The Home Valuation Report is an in-depth analysis detailing your home's value as well as a comparison with similar homes in the area
Home Values in the Area
Average Home Value in this Area
Purchase History
| Date | Buyer | Sale Price | Title Company |
|---|---|---|---|
| Parker Michael | $456,000 | -- | |
| Manalili Barbara | $444,000 | -- | |
| Welch Bernard C | $345,000 | -- | |
| M&M Nt | $105,000 | -- |
Source: Public Records
Mortgage History
| Date | Status | Borrower | Loan Amount |
|---|---|---|---|
| Open | M&M Nt | $405,000 | |
| Closed | Parker Michael | $410,400 | |
| Previous Owner | Manalili Barbara | $355,200 | |
| Previous Owner | Welch Bernard C | $310,500 |
Source: Public Records
Tax History Compared to Growth
Tax History
| Year | Tax Paid | Tax Assessment Tax Assessment Total Assessment is a certain percentage of the fair market value that is determined by local assessors to be the total taxable value of land and additions on the property. | Land | Improvement |
|---|---|---|---|---|
| 2025 | $8,397 | $725,100 | $0 | $725,100 |
| 2024 | $7,641 | $701,000 | $0 | $701,000 |
| 2023 | $7,305 | $680,200 | $0 | $680,200 |
| 2022 | $7,048 | $647,800 | $0 | $647,800 |
| 2021 | $6,912 | $647,800 | $0 | $647,800 |
| 2020 | $6,643 | $629,100 | $0 | $629,100 |
| 2019 | $6,438 | $610,800 | $0 | $610,800 |
| 2018 | $6,040 | $576,300 | $0 | $576,300 |
| 2017 | $5,760 | $543,900 | $0 | $543,900 |
| 2016 | $5,753 | $523,000 | $0 | $523,000 |
| 2015 | $5,752 | $475,000 | $0 | $475,000 |
| 2014 | $5,485 | $436,000 | $0 | $436,000 |
Source: Public Records
Map
Nearby Homes
- 15 Blackwood St Unit 2
- 30 Cumberland St
- 10 Cumberland St Unit 10-4
- 131 Saint Botolph St Unit 1
- 270 Huntington Ave Unit 706
- 270 Huntington Ave Unit 304
- 521 Columbus Ave Unit 4
- 592 Columbus Ave Unit 1
- 451-453 Massachusetts Ave Unit 8
- 68 W Rutland Square
- 221 W Springfield St Unit 3
- 23 Saint Stephen St Unit 23-3
- 144 Worcester St Unit 2
- 230-232 W Newton St Unit B
- 202 W Springfield St Unit 3
- 56 Rutland Square
- 231 W Newton St Unit 3
- 17 Symphony Rd Unit 8
- 17 Symphony Rd Unit 6
- 193 W Springfield St
- 9 Albemarle St Unit 5
- 9 Albemarle St Unit 4
- 9 Albemarle St Unit 2
- 9 Albemarle St Unit 1
- 7 Albemarle St Unit 5
- 7 Albemarle St Unit 4
- 7 Albemarle St Unit 3
- 7 Albemarle St Unit 2
- 7 Albemarle St Unit 1
- 9 Albemarle St Unit 5,9
- 7 Albemarle St Unit ll
- 7 Albemarle St Unit U2
- 7 Albemarle St
- 5 Albemarle St
- 5 Albemarle St Unit 4
- 5 Albemarle St Unit 3
- 5 Albemarle St Unit 2
- 5 Albemarle St Unit 1
- 5 Albemarle St Unit 6
- 5 Albemarle St Unit 20W