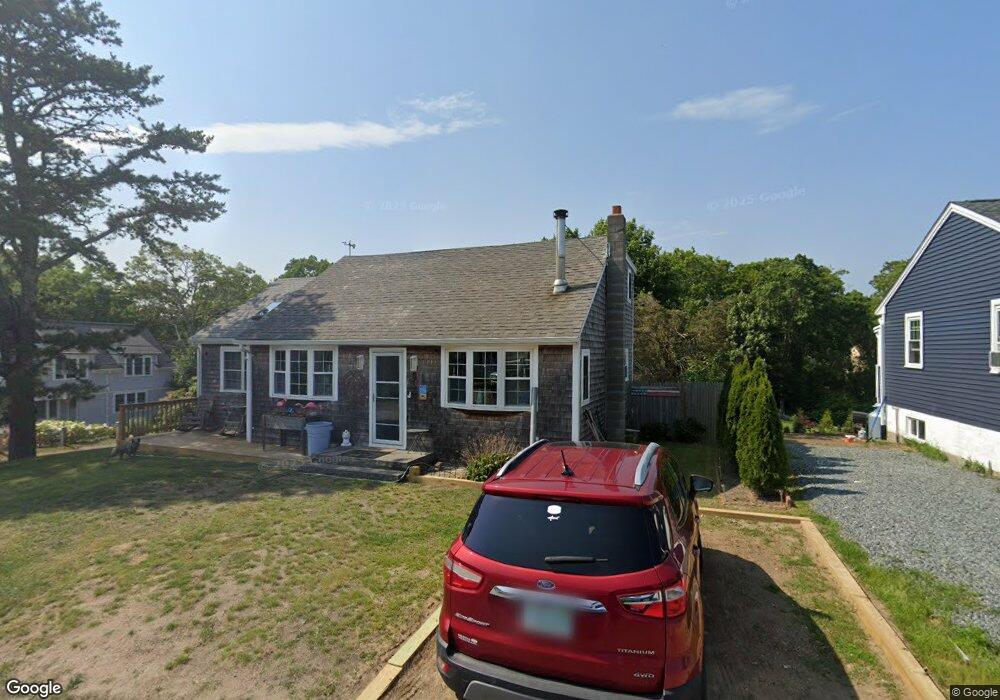
9 Allen Dr Plymouth, MA 02360
Estimated Value: $535,000 - $572,000
3
Beds
1
Bath
1,050
Sq Ft
$527/Sq Ft
Est. Value
About This Home
This home is located at 9 Allen Dr, Plymouth, MA 02360 and is currently estimated at $553,809, approximately $527 per square foot. 9 Allen Dr is a home located in Plymouth County with nearby schools including Indian Brook, Plymouth South Middle School, and Plymouth South High School.
Ownership History
Date
Name
Owned For
Owner Type
Purchase Details
Closed on
Aug 27, 2025
Sold by
Jenkins Richard and Jenkins Susan W
Bought by
Jenkins Ft and Jenkins
Current Estimated Value
Purchase Details
Closed on
Nov 21, 2024
Sold by
Jenkins T T and Jenkins J
Bought by
Jenkins Susan W and Jenkins Richard
Home Financials for this Owner
Home Financials are based on the most recent Mortgage that was taken out on this home.
Original Mortgage
$233,000
Interest Rate
6.32%
Mortgage Type
New Conventional
Purchase Details
Closed on
Oct 24, 2019
Sold by
Wagner-Jenkins Susan and Jenkins Susan
Bought by
Jenkins T T and Jenkins J
Purchase Details
Closed on
Mar 25, 1998
Sold by
Lacava James J
Bought by
Wagner-Jenkins Susan
Create a Home Valuation Report for This Property
The Home Valuation Report is an in-depth analysis detailing your home's value as well as a comparison with similar homes in the area
Home Values in the Area
Average Home Value in this Area
Purchase History
| Date | Buyer | Sale Price | Title Company |
|---|---|---|---|
| Jenkins Ft | -- | -- | |
| Jenkins Ft | -- | -- | |
| Jenkins Susan W | -- | None Available | |
| Jenkins Susan W | -- | None Available | |
| Jenkins Susan W | -- | None Available | |
| Jenkins T T | -- | -- | |
| Wagner-Jenkins Susan | $106,000 | -- | |
| Wagner-Jenkins Susan | $106,000 | -- |
Source: Public Records
Mortgage History
| Date | Status | Borrower | Loan Amount |
|---|---|---|---|
| Previous Owner | Jenkins Susan W | $233,000 | |
| Previous Owner | Wagner-Jenkins Susan | $75,000 |
Source: Public Records
Tax History Compared to Growth
Tax History
| Year | Tax Paid | Tax Assessment Tax Assessment Total Assessment is a certain percentage of the fair market value that is determined by local assessors to be the total taxable value of land and additions on the property. | Land | Improvement |
|---|---|---|---|---|
| 2025 | $4,987 | $393,000 | $182,100 | $210,900 |
| 2024 | $4,767 | $370,400 | $165,800 | $204,600 |
| 2023 | $4,659 | $339,800 | $150,300 | $189,500 |
| 2022 | $4,641 | $300,800 | $141,800 | $159,000 |
| 2021 | $4,471 | $276,700 | $141,800 | $134,900 |
| 2020 | $4,269 | $261,100 | $128,900 | $132,200 |
| 2019 | $4,176 | $252,500 | $120,300 | $132,200 |
| 2018 | $3,569 | $225,200 | $111,700 | $113,500 |
| 2017 | $3,517 | $212,100 | $111,700 | $100,400 |
| 2016 | $3,311 | $203,500 | $103,100 | $100,400 |
| 2015 | $3,096 | $199,200 | $98,800 | $100,400 |
| 2014 | $2,955 | $195,300 | $98,800 | $96,500 |
Source: Public Records
Map
Nearby Homes
- 28 Manomet Beach Blvd
- 125 Seaview Dr
- 3 Hiawatha Rd
- 9 Melix Ave
- 11 Ellisville Dr
- 26 Goelette Dr
- 115 Andrews Way
- 24 Drum Dr Unit 24
- 61 Crescent Ave
- 40 Drum Dr Unit 40
- 39 Miter Dr Unit 8-1
- 91 Miter Dr Unit 18-1
- 91 Miter Dr Unit 16-1
- 91 Miter Dr Unit 18-2
- 91 Miter Dr Unit 16-3
- The Hickory Plan at Alden's Reach - Attached & Detached Single Family Homes
- The Pine Plan at Alden's Reach - Attached & Detached Single Family Homes
- The Oak Plan at Alden's Reach - Attached & Detached Single Family Homes
- The Spruce Plan at Alden's Reach - Attached & Detached Single Family Homes
- 91 Miter Dr Unit 3-2