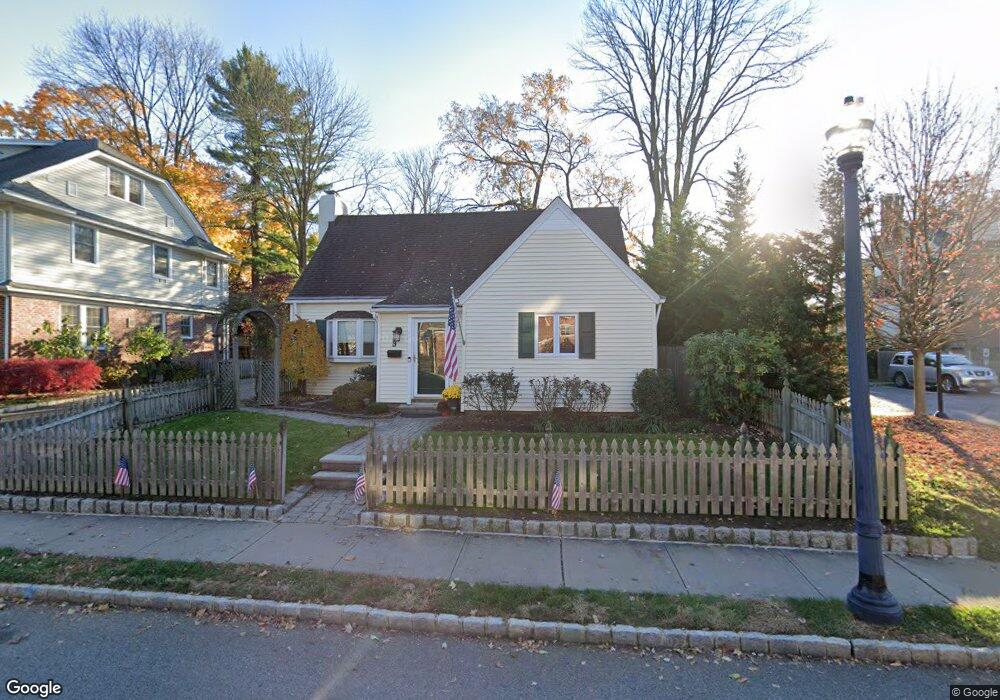
9 Altamont Ct Morristown, NJ 07960
Estimated Value: $707,000 - $807,000
3
Beds
2
Baths
1,525
Sq Ft
$497/Sq Ft
Est. Value
About This Home
This home is located at 9 Altamont Ct, Morristown, NJ 07960 and is currently estimated at $758,577, approximately $497 per square foot. 9 Altamont Ct is a home located in Morris County with nearby schools including Hillcrest School, Thomas Jefferson School, and Alexander Hamilton School.
Ownership History
Date
Name
Owned For
Owner Type
Purchase Details
Closed on
Sep 19, 2023
Sold by
Tackett George L and Tackett Patricia Dale
Bought by
Gabre Kennedy O and Gabre Karla M
Current Estimated Value
Home Financials for this Owner
Home Financials are based on the most recent Mortgage that was taken out on this home.
Original Mortgage
$438,750
Outstanding Balance
$429,669
Interest Rate
7.09%
Mortgage Type
New Conventional
Estimated Equity
$328,908
Purchase Details
Closed on
May 3, 1998
Sold by
Goelz Phillip C and Christensen Beth A
Bought by
Talarico Todd S and Talarico Heather T
Home Financials for this Owner
Home Financials are based on the most recent Mortgage that was taken out on this home.
Original Mortgage
$217,800
Interest Rate
6.92%
Create a Home Valuation Report for This Property
The Home Valuation Report is an in-depth analysis detailing your home's value as well as a comparison with similar homes in the area
Home Values in the Area
Average Home Value in this Area
Purchase History
| Date | Buyer | Sale Price | Title Company |
|---|---|---|---|
| Gabre Kennedy O | $585,000 | Acres Land Title | |
| Gabre Kennedy O | $585,000 | Acres Land Title | |
| Talarico Todd S | $242,000 | First American Title Ins Co |
Source: Public Records
Mortgage History
| Date | Status | Borrower | Loan Amount |
|---|---|---|---|
| Open | Gabre Kennedy O | $438,750 | |
| Closed | Gabre Kennedy O | $438,750 | |
| Previous Owner | Talarico Todd S | $217,800 |
Source: Public Records
Tax History Compared to Growth
Tax History
| Year | Tax Paid | Tax Assessment Tax Assessment Total Assessment is a certain percentage of the fair market value that is determined by local assessors to be the total taxable value of land and additions on the property. | Land | Improvement |
|---|---|---|---|---|
| 2025 | $9,368 | $594,800 | $368,000 | $226,800 |
| 2024 | $9,322 | $594,800 | $368,000 | $226,800 |
| 2023 | $9,322 | $320,800 | $210,100 | $110,700 |
| 2022 | $8,659 | $320,800 | $210,100 | $110,700 |
| 2021 | $8,659 | $320,800 | $210,100 | $110,700 |
| 2020 | $9,249 | $320,800 | $210,100 | $110,700 |
| 2019 | $9,245 | $320,800 | $210,100 | $110,700 |
| 2018 | $9,127 | $320,800 | $210,100 | $110,700 |
| 2017 | $8,854 | $320,800 | $210,100 | $110,700 |
| 2016 | $8,626 | $320,800 | $210,100 | $110,700 |
| 2015 | $8,171 | $320,800 | $210,100 | $110,700 |
| 2014 | $8,078 | $320,800 | $210,100 | $110,700 |
Source: Public Records
Map
Nearby Homes
- 21 Franklin Place
- 4 Perry St
- 40 Park502 Unit 502
- 40 Park - Unit 315 Unit 315
- 31 Garden St
- 15 Georgian Rd
- 39 Clinton Place
- 51 Mount Kemble Ave Unit 405
- 25 Phoenix Ave
- 180 Franklin St
- 58 Chestnut St Unit 1
- 61 Western Ave Unit C
- 86 Chestnut St
- 11 Hazel St Unit 1-2
- 60 Chestnut St Unit 2
- 320 South St Unit F
- 80 Western Ave
- 5E Dorado Dr Unit E
- 18 Hillairy Ave
- 11 Hillairy Ave
- 11 Altamont Ct
- 15 Altamont Ct
- 12 Altamont Ct
- 29 Elm St
- 14 Altamont Ct
- 10 Altamont Ct
- 10 Altamont Ct Unit 1
- 10 Altamont Ct Unit 2
- 10 Altamont Ct Unit 3
- 17 Altamont Ct
- 16 Altamont Ct
- 18 Altamont Ct
- 19 Altamont Ct
- 39 Elm St Unit 39B
- 2 Altamont Ct Unit 26
- 2 Altamont Ct Unit 7
- 39 Elm St Unit B
- 2 Altamont Ct Unit 18
- 2 Altamont Ct Unit 21
- 2 Altamont Ct Unit 2