
Landlord's Agent in 2019
Kristine Guindon
Joe Bean Real Estate
(508) 509-0050
5 Total Sales
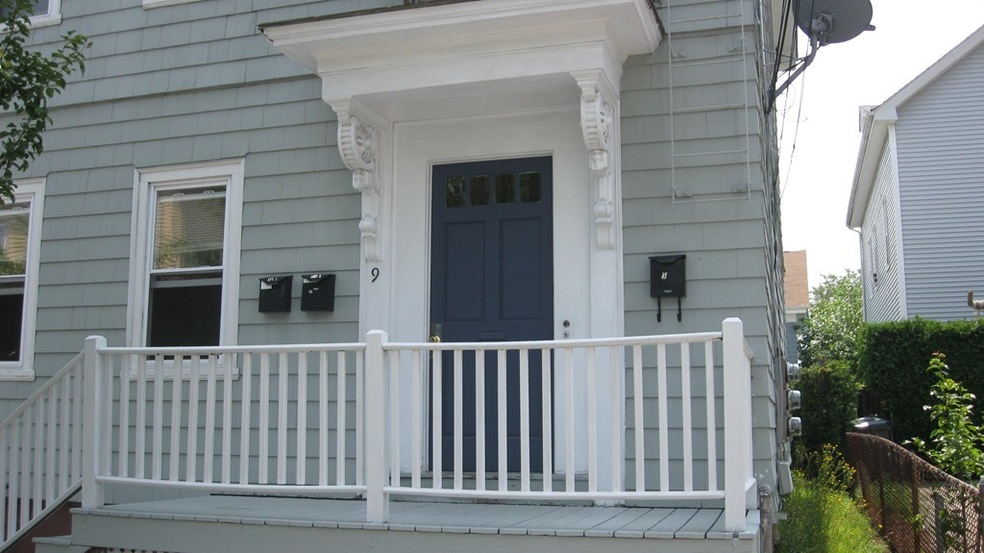

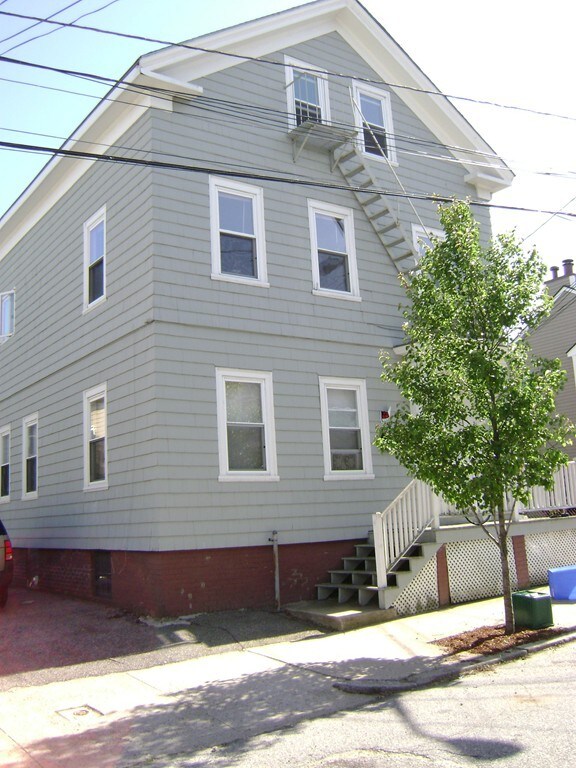
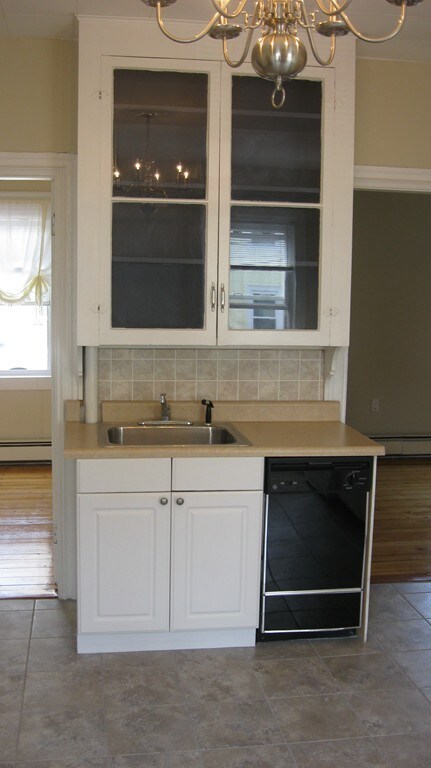
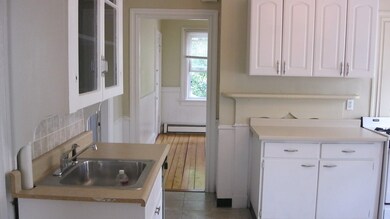
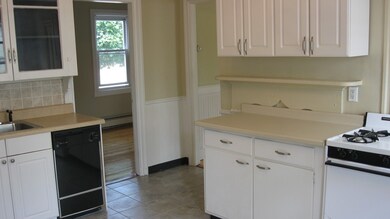
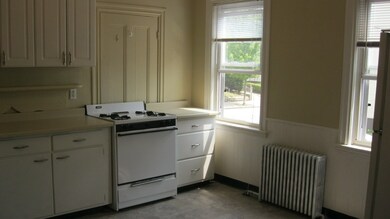
Great Fox Point location on the East Side of Providence!! Sunny and Spacious 2-bedroom apartment in close proximity to Wickendon, Thayer Street, Wayland Square, Brown, RISD & downtown Providence. Unit features eat-in-kitchen w/dishwasher, two nice size bedrooms, living room w/ hardwood floors, and gas heat. Washer/dryer on premises, and extra storage area in basement. Common Yard and Off-Street Parking. Available June1 or later. NO Fee. Pets Negotiable.
We collect this data history from publicly available records. To have your information removed, we recommend requesting removal directly through your county’s website.
| Date | Event | Price | List to Sale | Price per Sq Ft |
|---|---|---|---|---|
| 05/26/2019 05/26/19 | Rented | $1,300 | -7.1% | -- |
| 05/26/2019 05/26/19 | Under Contract | -- | -- | -- |
| 05/16/2019 05/16/19 | Off Market | $1,400 | -- | -- |
| 05/15/2019 05/15/19 | For Rent | $1,400 | +7.7% | -- |
| 06/06/2018 06/06/18 | Rented | $1,300 | 0.0% | -- |
| 05/21/2018 05/21/18 | Price Changed | $1,300 | -3.7% | $2 / Sq Ft |
| 05/08/2018 05/08/18 | For Rent | $1,350 | +3.8% | -- |
| 06/27/2017 06/27/17 | Rented | $1,300 | 0.0% | -- |
| 06/25/2017 06/25/17 | Under Contract | -- | -- | -- |
| 05/25/2017 05/25/17 | Price Changed | $1,300 | 0.0% | $2 / Sq Ft |
| 05/17/2017 05/17/17 | For Rent | $1,300 | +13.0% | -- |
| 08/17/2014 08/17/14 | Rented | $1,150 | 0.0% | -- |
| 07/18/2014 07/18/14 | Under Contract | -- | -- | -- |
| 07/14/2014 07/14/14 | For Rent | $1,150 | -- | -- |
We collect this data history from publicly available records. To have your information removed, we recommend requesting removal directly through your county’s website.
| Year | Tax Paid | Tax Assessment Tax Assessment Total Assessment is a certain percentage of the fair market value that is determined by local assessors to be the total taxable value of land and additions on the property. | Land | Improvement |
|---|---|---|---|---|
| 2025 | $13,376 | $955,400 | $0 | $955,400 |
| 2024 | $12,950 | $705,700 | $0 | $0 |
| 2023 | $4,266 | $232,500 | $0 | $232,500 |
| 2022 | $12,561 | $705,700 | $340,200 | $365,500 |
| 2021 | $11,575 | $471,300 | $225,200 | $246,100 |
| 2020 | $11,575 | $471,300 | $225,200 | $246,100 |
| 2019 | $11,575 | $471,300 | $225,200 | $246,100 |
| 2018 | $10,953 | $342,700 | $207,700 | $135,000 |
| 2017 | $10,953 | $342,700 | $207,700 | $135,000 |
| 2016 | $10,953 | $342,700 | $207,700 | $135,000 |
| 2015 | $11,979 | $361,900 | $207,700 | $154,200 |
| 2014 | $12,214 | $361,900 | $207,700 | $154,200 |
| 2013 | $12,214 | $361,900 | $207,700 | $154,200 |
Landlord's Agent in 2019
Kristine Guindon
Joe Bean Real Estate
(508) 509-0050
5 Total Sales
Source: MLS Property Information Network (MLS PIN)
MLS Number: 72500984
APN: PROV M:14 L:231
Disclaimer: Certain information contained herein is derived from information provided by parties other than Homes.com. All information provided is deemed reliable, but is not guaranteed to be accurate and should be independently verified.
![]() The property listing data and information, or the Images, set forth herein were provided to MLS Property Information Network, Inc. from third party sources, including sellers, lessors and public records, and were compiled by MLS Property Information Network, Inc. The property listing data and information, and the Images, are for the personal, non-commercial use of consumers having a good faith interest in purchasing or leasing listed properties of the type displayed to them and may not be used for any purpose other than to identify prospective properties which such consumers may have a good faith interest in purchasing or leasing. MLS Property Information Network, Inc. and its subscribers disclaim any and all representations and warranties as to the accuracy of the property listing data and information, or as to the accuracy of any of the Images, set forth herein.
The property listing data and information, or the Images, set forth herein were provided to MLS Property Information Network, Inc. from third party sources, including sellers, lessors and public records, and were compiled by MLS Property Information Network, Inc. The property listing data and information, and the Images, are for the personal, non-commercial use of consumers having a good faith interest in purchasing or leasing listed properties of the type displayed to them and may not be used for any purpose other than to identify prospective properties which such consumers may have a good faith interest in purchasing or leasing. MLS Property Information Network, Inc. and its subscribers disclaim any and all representations and warranties as to the accuracy of the property listing data and information, or as to the accuracy of any of the Images, set forth herein.
Ask me questions while you tour the home.