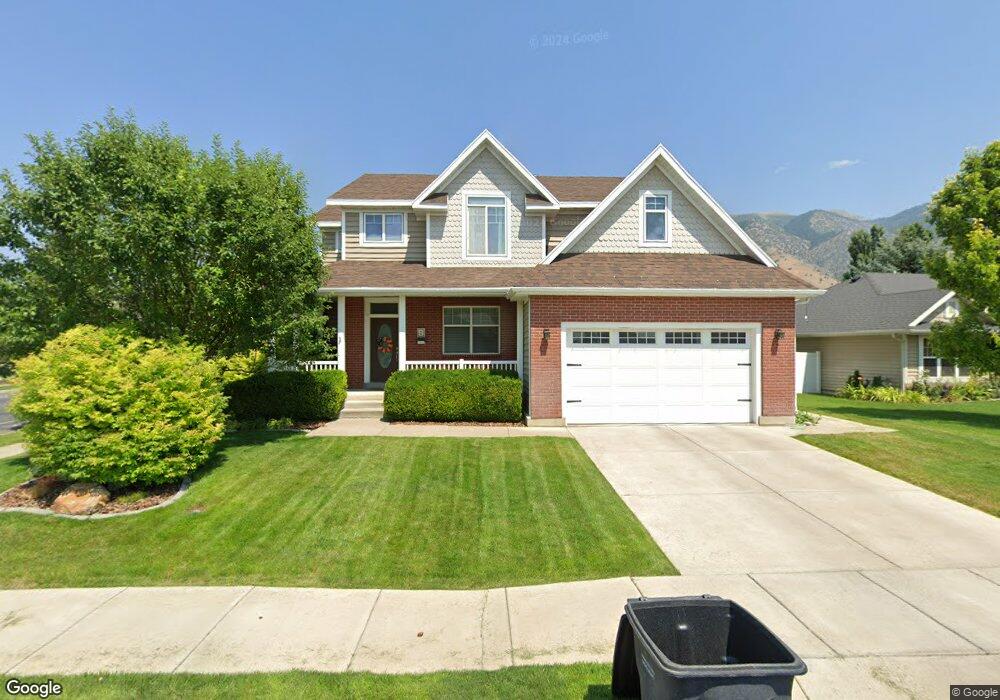
9 Andrews Ln Providence, UT 84332
Estimated Value: $593,625 - $746,000
5
Beds
5
Baths
3,636
Sq Ft
$178/Sq Ft
Est. Value
About This Home
This home is located at 9 Andrews Ln, Providence, UT 84332 and is currently estimated at $645,406, approximately $177 per square foot. 9 Andrews Ln is a home located in Cache County with nearby schools including Providence School, Spring Creek Middle School, and South Cache Middle School.
Ownership History
Date
Name
Owned For
Owner Type
Purchase Details
Closed on
Mar 1, 2025
Sold by
Kelstrom Brad J and Kelstrom Lindsey L
Bought by
Kelstrom Lindsey L
Current Estimated Value
Purchase Details
Closed on
Sep 14, 2017
Sold by
Zhu Eric and Hu Rose
Bought by
Kelstrom Brad J and Kelstrom Lindsey L
Home Financials for this Owner
Home Financials are based on the most recent Mortgage that was taken out on this home.
Original Mortgage
$243,750
Interest Rate
3.89%
Mortgage Type
New Conventional
Purchase Details
Closed on
Aug 12, 2011
Sold by
Fedkenheuer William A and Fedkenheuer Yi Ching
Bought by
Zhu Eric and Hu Rose
Purchase Details
Closed on
Sep 19, 2006
Sold by
Bargeron Stephen and Bargeron Marci L
Bought by
Fedkenheuer William A and Fedkenheuer Yi Ching
Home Financials for this Owner
Home Financials are based on the most recent Mortgage that was taken out on this home.
Original Mortgage
$191,200
Interest Rate
6.51%
Mortgage Type
New Conventional
Create a Home Valuation Report for This Property
The Home Valuation Report is an in-depth analysis detailing your home's value as well as a comparison with similar homes in the area
Home Values in the Area
Average Home Value in this Area
Purchase History
| Date | Buyer | Sale Price | Title Company |
|---|---|---|---|
| Kelstrom Lindsey L | $100,000 | Stewart Title | |
| Kelstrom Brad J | -- | -- | |
| Zhu Eric | -- | Northern Title Company | |
| Fedkenheuer William A | -- | American Secure Title |
Source: Public Records
Mortgage History
| Date | Status | Borrower | Loan Amount |
|---|---|---|---|
| Previous Owner | Kelstrom Brad J | $243,750 | |
| Previous Owner | Fedkenheuer William A | $191,200 |
Source: Public Records
Tax History Compared to Growth
Tax History
| Year | Tax Paid | Tax Assessment Tax Assessment Total Assessment is a certain percentage of the fair market value that is determined by local assessors to be the total taxable value of land and additions on the property. | Land | Improvement |
|---|---|---|---|---|
| 2025 | $2,412 | $338,215 | $0 | $0 |
| 2024 | $2,600 | $339,195 | $0 | $0 |
| 2023 | $2,734 | $335,965 | $0 | $0 |
| 2022 | $2,512 | $291,605 | $0 | $0 |
| 2021 | $2,442 | $434,270 | $50,600 | $383,670 |
| 2020 | $2,026 | $334,087 | $50,600 | $283,487 |
| 2019 | $2,140 | $334,086 | $50,600 | $283,486 |
| 2018 | $1,864 | $297,110 | $50,600 | $246,510 |
| 2017 | $1,728 | $145,805 | $0 | $0 |
| 2016 | $1,747 | $145,805 | $0 | $0 |
| 2015 | $1,629 | $135,670 | $0 | $0 |
| 2014 | $1,589 | $135,670 | $0 | $0 |
| 2013 | $1,502 | $135,670 | $0 | $0 |
Source: Public Records
Map
Nearby Homes
- 23 Andrews Ln
- 27 W Spring Creek Pkwy
- 11 Mountain View Ln
- 315 Mountain View Ln
- 66 E Springs Ln
- 76 E Springs Ln
- 672 N 170 E
- 201 E 580 N
- 175 E 550 N
- 821 S 525 E
- 208 E 610 N
- 216 E 610 N
- 289 N 100 E
- 500 750 E Unit 50
- 671 N 200 E
- Lyndhurst Plan at Vineyard - Providence
- Fairview Plan at Vineyard - Providence
- Auburn Plan at Vineyard - Providence
- Springhill Plan at Vineyard - Providence
- Madison Plan at Vineyard - Providence
- 15 Andrew's Ln
- 40 E Spring Creek Pkwy
- 21 E Spring Creek Pkwy
- 29 E Spring Creek Pkwy
- 8 Andrews Ln
- 8 Andrews Ln Unit 88
- 8 Andrew's Ln
- 14 Andrews Ln
- 5 E Spring Creek Pkwy
- 52 E Spring Creek Pkwy
- 29 Andrews Ln
- 43 E Spring Creek Pkwy
- 20 Andrews Ln
- 9 W Spring Creek Pkwy
- 64 E Spring Creek Pkwy
- 26 Andrews Ln
- 24 W Spring Creek Pkwy
- 39 Andrews Ln
- 39 Andrew's Ln
- 39 Andrew's Ln Unit 69