9 Appleton St Unit 308 Boston, MA 02116
South End NeighborhoodHighlights
- Medical Services
- Wood Flooring
- Intercom
- Property is near public transit
- Elevator
- 5-minute walk to Bay Village Neighborhood Park
About This Home
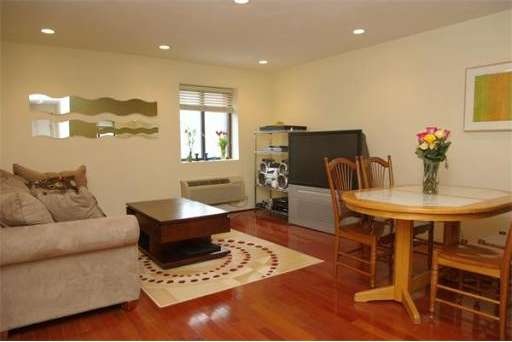
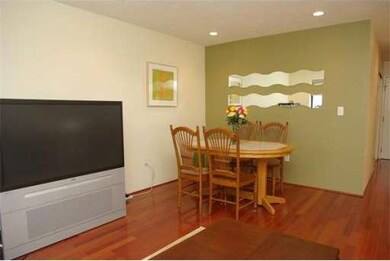
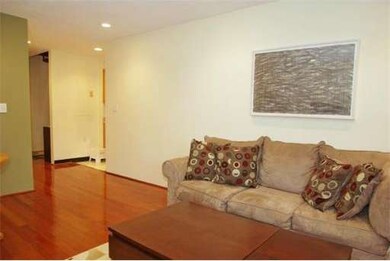
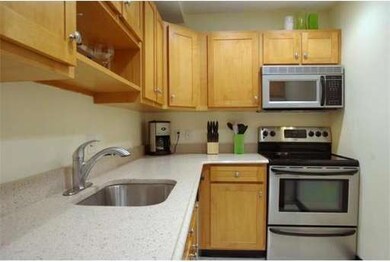
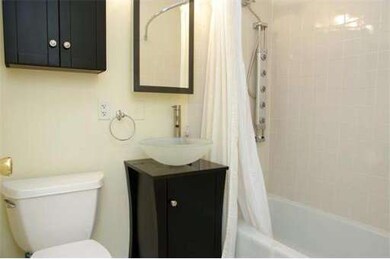
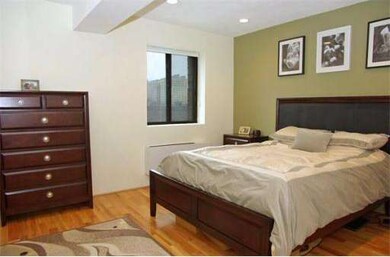
As of March 2017Lovely one bedroom duplex home in an elevator building on desirable Appleton Street, just steps away from all that the city has to offer. Close to South End and Back Bay shops and restaurants. Close to Tufts adn BU Medical Centers. Easy access to area highways and the T. Generous living / dining room, renovated kitchen and bath, oversized bedroom, excellent closet space and hardwood flooring throughout.
Last Agent to Sell the Property
William Dellea
Coldwell Banker Realty - Boston License #449516816 Listed on: 02/14/2011
Property Details
Home Type
- Condominium
Est. Annual Taxes
- $3,013
Year Built
- Built in 1875
Home Design
- Brick Exterior Construction
- Slate Roof
- Rubber Roof
Interior Spaces
- 700 Sq Ft Home
- 2-Story Property
- Insulated Windows
- Wood Flooring
- Intercom
Kitchen
- Range
- Microwave
- Dishwasher
- Disposal
Bedrooms and Bathrooms
- 1 Bedroom
- Primary bedroom located on fourth floor
- 1 Full Bathroom
Location
- Property is near public transit
Utilities
- Cooling System Mounted In Outer Wall Opening
- 2 Cooling Zones
- Forced Air Heating System
- 2 Heating Zones
- Heat Pump System
- Individual Controls for Heating
- Wall Furnace
- 220 Volts
- 100 Amp Service
- Electric Water Heater
Listing and Financial Details
- Assessor Parcel Number 3357667
Community Details
Overview
- Property has a Home Owners Association
- Association fees include water, sewer, insurance, maintenance structure, snow removal
- 36 Units
- Mid-Rise Condominium
- 9 Appleton Place Condominiums Community
Amenities
- Medical Services
- Shops
- Coin Laundry
- Elevator
Pet Policy
- Breed Restrictions
Ownership History
Purchase Details
Purchase Details
Home Financials for this Owner
Home Financials are based on the most recent Mortgage that was taken out on this home.Purchase Details
Home Financials for this Owner
Home Financials are based on the most recent Mortgage that was taken out on this home.Purchase Details
Home Financials for this Owner
Home Financials are based on the most recent Mortgage that was taken out on this home.Purchase Details
Home Financials for this Owner
Home Financials are based on the most recent Mortgage that was taken out on this home.Similar Homes in the area
Home Values in the Area
Average Home Value in this Area
Purchase History
| Date | Type | Sale Price | Title Company |
|---|---|---|---|
| Deed | -- | -- | |
| Not Resolvable | $589,000 | -- | |
| Not Resolvable | $343,500 | -- | |
| Land Court Massachusetts | $357,000 | -- | |
| Land Court Massachusetts | $285,000 | -- |
Mortgage History
| Date | Status | Loan Amount | Loan Type |
|---|---|---|---|
| Previous Owner | $494,000 | New Conventional | |
| Previous Owner | $25,000 | No Value Available | |
| Previous Owner | $350,885 | New Conventional | |
| Previous Owner | $271,000 | No Value Available | |
| Previous Owner | $273,750 | No Value Available | |
| Previous Owner | $285,600 | Purchase Money Mortgage | |
| Previous Owner | $228,000 | Purchase Money Mortgage |
Property History
| Date | Event | Price | Change | Sq Ft Price |
|---|---|---|---|---|
| 02/13/2025 02/13/25 | Rented | $3,250 | 0.0% | -- |
| 02/10/2025 02/10/25 | Under Contract | -- | -- | -- |
| 01/27/2025 01/27/25 | Price Changed | $3,250 | -1.5% | $5 / Sq Ft |
| 01/11/2025 01/11/25 | For Rent | $3,300 | +3.1% | -- |
| 08/23/2021 08/23/21 | Rented | -- | -- | -- |
| 08/09/2021 08/09/21 | For Rent | $3,200 | 0.0% | -- |
| 07/09/2020 07/09/20 | Rented | $3,200 | 0.0% | -- |
| 06/23/2020 06/23/20 | For Rent | $3,200 | 0.0% | -- |
| 06/28/2018 06/28/18 | Rented | $3,200 | 0.0% | -- |
| 06/23/2018 06/23/18 | Under Contract | -- | -- | -- |
| 06/20/2018 06/20/18 | For Rent | $3,200 | 0.0% | -- |
| 03/15/2017 03/15/17 | Sold | $650,000 | +1.6% | $929 / Sq Ft |
| 02/01/2017 02/01/17 | Pending | -- | -- | -- |
| 01/22/2017 01/22/17 | For Sale | $639,900 | -1.6% | $914 / Sq Ft |
| 11/16/2016 11/16/16 | Off Market | $650,000 | -- | -- |
| 11/15/2016 11/15/16 | For Sale | $639,900 | 0.0% | $914 / Sq Ft |
| 09/21/2016 09/21/16 | Rented | $3,150 | 0.0% | -- |
| 09/20/2016 09/20/16 | Under Contract | -- | -- | -- |
| 08/11/2016 08/11/16 | Price Changed | $3,150 | -1.6% | $5 / Sq Ft |
| 07/14/2016 07/14/16 | Price Changed | $3,200 | -8.6% | $5 / Sq Ft |
| 06/16/2016 06/16/16 | For Rent | $3,500 | +2.9% | -- |
| 04/01/2016 04/01/16 | Rented | $3,400 | -2.9% | -- |
| 03/31/2016 03/31/16 | Under Contract | -- | -- | -- |
| 03/23/2016 03/23/16 | For Rent | $3,500 | 0.0% | -- |
| 11/06/2015 11/06/15 | Sold | $589,000 | 0.0% | $841 / Sq Ft |
| 09/22/2015 09/22/15 | Off Market | $589,000 | -- | -- |
| 09/22/2015 09/22/15 | Pending | -- | -- | -- |
| 08/17/2015 08/17/15 | Price Changed | $599,000 | -4.8% | $856 / Sq Ft |
| 08/06/2015 08/06/15 | For Sale | $629,000 | +83.1% | $899 / Sq Ft |
| 01/25/2012 01/25/12 | Sold | $343,500 | -1.6% | $491 / Sq Ft |
| 12/02/2011 12/02/11 | Pending | -- | -- | -- |
| 08/16/2011 08/16/11 | Price Changed | $349,000 | -2.8% | $499 / Sq Ft |
| 08/04/2011 08/04/11 | Price Changed | $359,000 | -0.3% | $513 / Sq Ft |
| 07/11/2011 07/11/11 | Price Changed | $359,900 | -4.0% | $514 / Sq Ft |
| 04/26/2011 04/26/11 | Price Changed | $374,900 | -1.1% | $536 / Sq Ft |
| 03/29/2011 03/29/11 | Price Changed | $379,000 | -1.3% | $541 / Sq Ft |
| 03/02/2011 03/02/11 | Price Changed | $384,000 | -1.3% | $549 / Sq Ft |
| 02/14/2011 02/14/11 | For Sale | $389,000 | -- | $556 / Sq Ft |
Tax History Compared to Growth
Tax History
| Year | Tax Paid | Tax Assessment Tax Assessment Total Assessment is a certain percentage of the fair market value that is determined by local assessors to be the total taxable value of land and additions on the property. | Land | Improvement |
|---|---|---|---|---|
| 2025 | $8,855 | $764,700 | $0 | $764,700 |
| 2024 | $8,017 | $735,500 | $0 | $735,500 |
| 2023 | $7,665 | $713,700 | $0 | $713,700 |
| 2022 | $7,396 | $679,800 | $0 | $679,800 |
| 2021 | $7,253 | $679,800 | $0 | $679,800 |
| 2020 | $6,620 | $626,900 | $0 | $626,900 |
| 2019 | $6,370 | $604,400 | $0 | $604,400 |
| 2018 | $5,977 | $570,300 | $0 | $570,300 |
| 2017 | $5,700 | $538,200 | $0 | $538,200 |
| 2016 | $5,492 | $499,300 | $0 | $499,300 |
| 2015 | $5,573 | $460,200 | $0 | $460,200 |
| 2014 | $5,313 | $422,300 | $0 | $422,300 |
Agents Affiliated with this Home
-
Tami Schein
T
Seller's Agent in 2025
Tami Schein
Coldwell Banker Realty - Newton
(617) 593-7755
8 Total Sales
-
Adriano Varano

Seller's Agent in 2021
Adriano Varano
Keller Williams Realty
(339) 222-0871
347 Total Sales
-
Bayley & Natoli
B
Buyer's Agent in 2021
Bayley & Natoli
Compass
(617) 206-3333
5 in this area
36 Total Sales
-
Erin Piccirilli

Buyer's Agent in 2018
Erin Piccirilli
Broad Street Boutique Realty LLC
(617) 360-1391
1 in this area
23 Total Sales
-
Gentile Visco Group
G
Seller's Agent in 2017
Gentile Visco Group
RTN Realty Advisors LLC.
1 in this area
31 Total Sales
-
Stephen Visco
S
Seller's Agent in 2016
Stephen Visco
East Coast Realty, Inc.
(857) 540-9252
1 in this area
13 Total Sales
Map
Source: MLS Property Information Network (MLS PIN)
MLS Number: 71188205
APN: CBOS-000000-000005-000697-000050
- 9 Appleton St Unit 406
- 5 Appleton St Unit 2D
- 58 Chandler St
- 36 Appleton St Unit 4
- 17 Cazenove St Unit 404
- 75 Clarendon St Unit 505
- 70 Clarendon St Unit 1
- 18 Milford St Unit 2
- 2 Clarendon St Unit 606
- 134 Arlington St
- 103 Appleton St Unit 3
- 567 Tremont St Unit 20
- 2A Milford St Unit 1
- 2A Milford St Unit 4
- 2A Milford St Unit 3
- 9 Bond St
- 400 Stuart St Unit 15J
- 400 Stuart St Unit 17C
- 150 Chandler St Unit 6
- 77 E Berkeley St Unit 4
