Estimated Value: $202,000 - $233,737
4
Beds
2
Baths
1,607
Sq Ft
$133/Sq Ft
Est. Value
About This Home
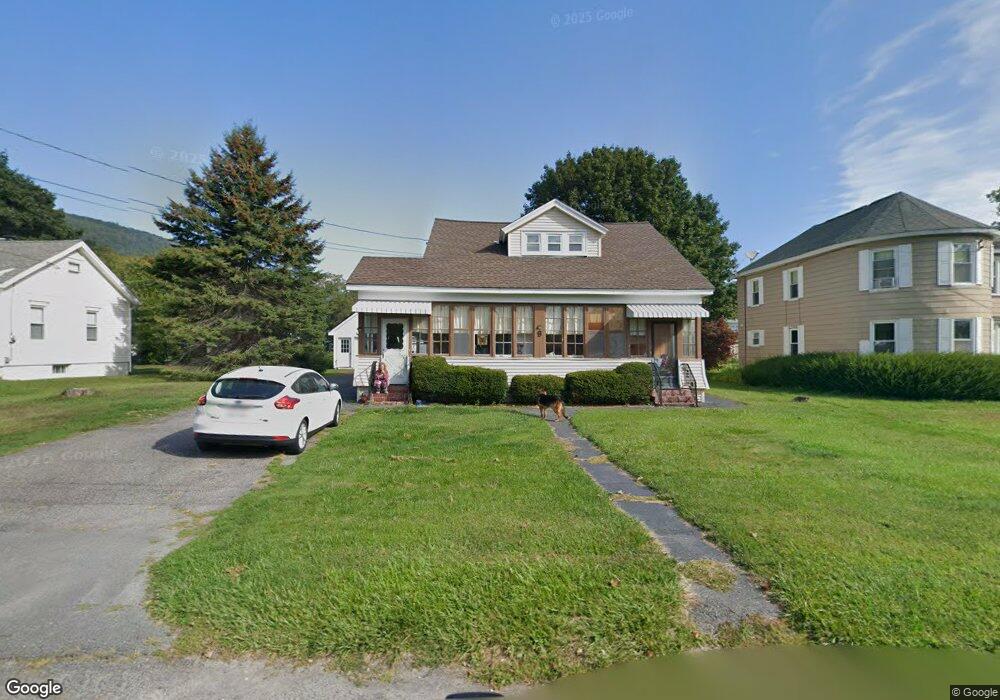
This home is located at 9 Apremont St, Adams, MA 01220 and is currently estimated at $213,684, approximately $132 per square foot. 9 Apremont St is a home located in Berkshire County with nearby schools including Hoosac Valley Middle & High School, Berkshire Arts & Technology Charter Public School, and St. Stanislaus Kostka School.
Ownership History
Date
Name
Owned For
Owner Type
Purchase Details
Closed on
May 12, 2006
Sold by
Salvato Bruce M and Salvato Christine J
Bought by
Masse Darlene C
Current Estimated Value
Home Financials for this Owner
Home Financials are based on the most recent Mortgage that was taken out on this home.
Original Mortgage
$106,700
Outstanding Balance
$61,796
Interest Rate
6.4%
Mortgage Type
Purchase Money Mortgage
Estimated Equity
$151,888
Purchase Details
Closed on
Sep 15, 2004
Sold by
Salvato Elizabeth T
Bought by
Salvato Bruce M
Create a Home Valuation Report for This Property
The Home Valuation Report is an in-depth analysis detailing your home's value as well as a comparison with similar homes in the area
Home Values in the Area
Average Home Value in this Area
Purchase History
| Date | Buyer | Sale Price | Title Company |
|---|---|---|---|
| Masse Darlene C | $110,000 | -- | |
| Salvato Bruce M | -- | -- |
Source: Public Records
Mortgage History
| Date | Status | Borrower | Loan Amount |
|---|---|---|---|
| Open | Masse Darlene C | $106,700 |
Source: Public Records
Tax History Compared to Growth
Tax History
| Year | Tax Paid | Tax Assessment Tax Assessment Total Assessment is a certain percentage of the fair market value that is determined by local assessors to be the total taxable value of land and additions on the property. | Land | Improvement |
|---|---|---|---|---|
| 2025 | $2,907 | $170,900 | $45,300 | $125,600 |
| 2024 | $2,754 | $157,000 | $42,400 | $114,600 |
| 2023 | $2,619 | $141,200 | $39,100 | $102,100 |
| 2022 | $2,760 | $132,100 | $34,000 | $98,100 |
| 2021 | $2,873 | $127,000 | $34,000 | $93,000 |
| 2020 | $2,763 | $126,300 | $34,300 | $92,000 |
| 2019 | $2,702 | $126,300 | $34,300 | $92,000 |
| 2018 | $2,765 | $124,500 | $34,300 | $90,200 |
| 2017 | $2,661 | $124,500 | $34,300 | $90,200 |
| 2016 | $2,359 | $110,300 | $34,300 | $76,000 |
| 2015 | $2,317 | $108,400 | $36,100 | $72,300 |
| 2014 | $2,091 | $104,800 | $36,100 | $68,700 |
Source: Public Records
Map
Nearby Homes