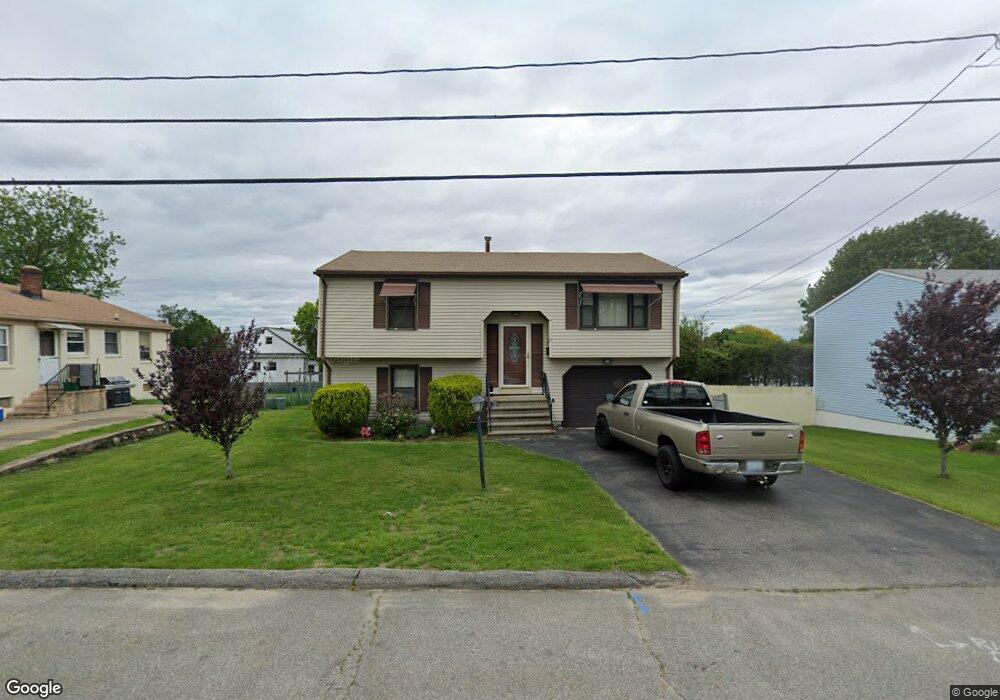
9 Argonne St Johnston, RI 02919
Hartford Avenue NeighborhoodEstimated Value: $393,000 - $434,000
2
Beds
2
Baths
922
Sq Ft
$453/Sq Ft
Est. Value
About This Home
This home is located at 9 Argonne St, Johnston, RI 02919 and is currently estimated at $417,274, approximately $452 per square foot. 9 Argonne St is a home located in Providence County with nearby schools including Mazomanie Elementary School, Johnston Senior High School, and Achievement First Promesa.
Ownership History
Date
Name
Owned For
Owner Type
Purchase Details
Closed on
Aug 5, 2016
Sold by
Carruolo Donna and Mattoni Deborah
Bought by
Ford John N
Current Estimated Value
Home Financials for this Owner
Home Financials are based on the most recent Mortgage that was taken out on this home.
Original Mortgage
$140,415
Outstanding Balance
$111,718
Interest Rate
3.56%
Mortgage Type
New Conventional
Estimated Equity
$305,556
Purchase Details
Closed on
May 27, 2014
Sold by
Ford Ann M
Bought by
Carruolo Donna and Mattoni Deborah
Create a Home Valuation Report for This Property
The Home Valuation Report is an in-depth analysis detailing your home's value as well as a comparison with similar homes in the area
Home Values in the Area
Average Home Value in this Area
Purchase History
| Date | Buyer | Sale Price | Title Company |
|---|---|---|---|
| Ford John N | $179,500 | -- | |
| Carruolo Donna | -- | -- | |
| Ford John N | $179,500 | -- | |
| Carruolo Donna | -- | -- |
Source: Public Records
Mortgage History
| Date | Status | Borrower | Loan Amount |
|---|---|---|---|
| Open | Ford John N | $140,415 | |
| Closed | Carruolo Donna | $140,415 |
Source: Public Records
Tax History Compared to Growth
Tax History
| Year | Tax Paid | Tax Assessment Tax Assessment Total Assessment is a certain percentage of the fair market value that is determined by local assessors to be the total taxable value of land and additions on the property. | Land | Improvement |
|---|---|---|---|---|
| 2025 | $4,764 | $305,000 | $86,900 | $218,100 |
| 2024 | $4,667 | $305,000 | $86,900 | $218,100 |
| 2023 | $4,667 | $305,000 | $86,900 | $218,100 |
| 2022 | $3,605 | $193,900 | $66,800 | $127,100 |
| 2021 | $4,506 | $193,900 | $66,800 | $127,100 |
| 2018 | $4,728 | $172,000 | $52,400 | $119,600 |
| 2016 | $6,256 | $172,000 | $52,400 | $119,600 |
| 2015 | $4,580 | $158,000 | $54,800 | $103,200 |
| 2014 | $2,341 | $158,000 | $54,800 | $103,200 |
| 2013 | $4,543 | $158,000 | $54,800 | $103,200 |
Source: Public Records
Map
Nearby Homes
- 6 Flanders St
- 0 Woodbine St
- 71 Waveland St
- 1137 Hartford Ave Unit 3A
- 1141 Hartford Ave Unit 4B
- 46 Auburn Ave
- 19 S Long St
- 10 S Long St
- 29 Dix Ave
- 13 Ivanhoe St
- 16 Homestead Ave
- 12 Oakland Ave
- 0 Eagle St
- 11 Traver Ave Unit 1
- 50 Rosemont Ave
- 2 Fairmount Ave
- 91 Clifton St
- 35 Hedley Ave
- 33 Harding Ave
- 0 Jackson Ave