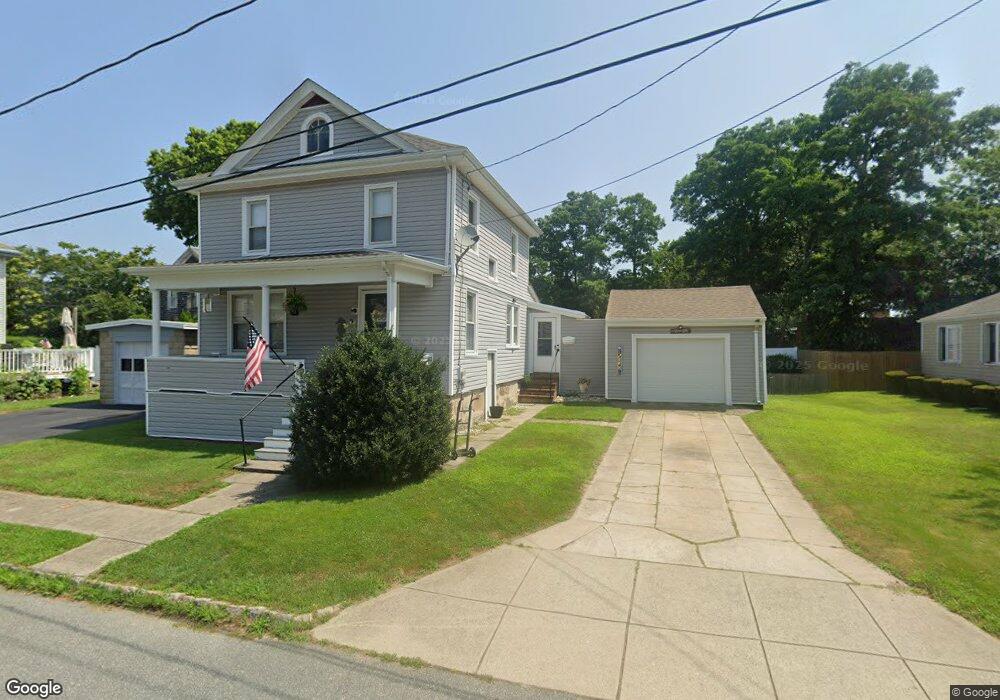
9 Autumn St Fairhaven, MA 02719
Estimated Value: $454,000 - $516,000
3
Beds
2
Baths
1,375
Sq Ft
$351/Sq Ft
Est. Value
About This Home
This home is located at 9 Autumn St, Fairhaven, MA 02719 and is currently estimated at $482,946, approximately $351 per square foot. 9 Autumn St is a home located in Bristol County with nearby schools including Fairhaven High School, City On A Hill Charter Public School New Bedford, and St. Joseph School.
Ownership History
Date
Name
Owned For
Owner Type
Purchase Details
Closed on
Jul 23, 2004
Sold by
Hughes Ryan R
Bought by
Ferrero Ronald J
Current Estimated Value
Home Financials for this Owner
Home Financials are based on the most recent Mortgage that was taken out on this home.
Original Mortgage
$45,000
Interest Rate
6.16%
Purchase Details
Closed on
Mar 29, 2002
Sold by
Tate Norman W and Tate Ralph J
Bought by
Hughes Ryan R
Create a Home Valuation Report for This Property
The Home Valuation Report is an in-depth analysis detailing your home's value as well as a comparison with similar homes in the area
Home Values in the Area
Average Home Value in this Area
Purchase History
| Date | Buyer | Sale Price | Title Company |
|---|---|---|---|
| Ferrero Ronald J | $220,000 | -- | |
| Hughes Ryan R | $153,000 | -- |
Source: Public Records
Mortgage History
| Date | Status | Borrower | Loan Amount |
|---|---|---|---|
| Open | Hughes Ryan R | $252,000 | |
| Closed | Hughes Ryan R | $25,500 | |
| Closed | Hughes Ryan R | $45,000 |
Source: Public Records
Tax History Compared to Growth
Tax History
| Year | Tax Paid | Tax Assessment Tax Assessment Total Assessment is a certain percentage of the fair market value that is determined by local assessors to be the total taxable value of land and additions on the property. | Land | Improvement |
|---|---|---|---|---|
| 2025 | $35 | $371,900 | $170,800 | $201,100 |
| 2024 | $3,345 | $362,400 | $170,800 | $191,600 |
| 2023 | $3,266 | $328,200 | $149,600 | $178,600 |
| 2022 | $3,176 | $310,800 | $139,000 | $171,800 |
| 2021 | $342 | $266,700 | $125,800 | $140,900 |
| 2020 | $2,950 | $266,700 | $125,800 | $140,900 |
| 2019 | $2,741 | $234,900 | $104,300 | $130,600 |
| 2018 | $2,621 | $223,100 | $99,300 | $123,800 |
| 2017 | $2,153 | $215,000 | $99,300 | $115,700 |
| 2016 | $2,510 | $206,100 | $99,300 | $106,800 |
| 2015 | $2,429 | $199,900 | $99,300 | $100,600 |
Source: Public Records
Map
Nearby Homes