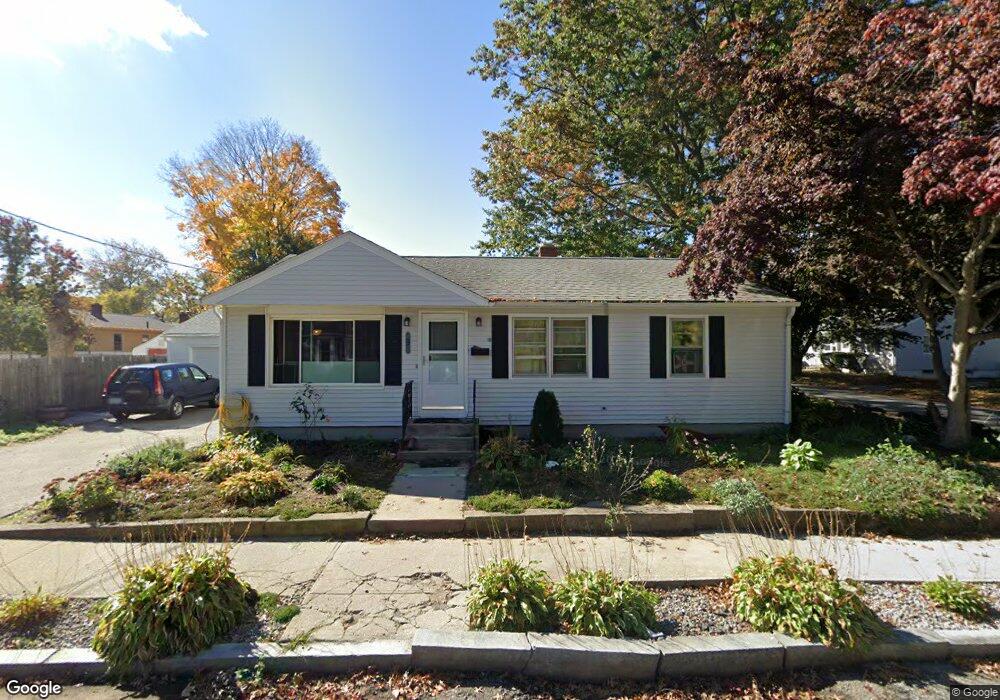
9 Bagalia Rd Providence, RI 02904
Wanskuck NeighborhoodEstimated Value: $362,000 - $395,000
3
Beds
1
Bath
1,350
Sq Ft
$278/Sq Ft
Est. Value
About This Home
This home is located at 9 Bagalia Rd, Providence, RI 02904 and is currently estimated at $374,891, approximately $277 per square foot. 9 Bagalia Rd is a home located in Providence County with nearby schools including St. Augustine School and The San Miguel School.
Ownership History
Date
Name
Owned For
Owner Type
Purchase Details
Closed on
Jul 28, 2000
Sold by
Nahabedian Glenn V and Nahabedian Robin A
Bought by
Mahoney John T and Mahoney Amy A
Current Estimated Value
Create a Home Valuation Report for This Property
The Home Valuation Report is an in-depth analysis detailing your home's value as well as a comparison with similar homes in the area
Home Values in the Area
Average Home Value in this Area
Purchase History
| Date | Buyer | Sale Price | Title Company |
|---|---|---|---|
| Mahoney John T | $100,000 | -- |
Source: Public Records
Mortgage History
| Date | Status | Borrower | Loan Amount |
|---|---|---|---|
| Open | Mahoney John T | $136,800 | |
| Closed | Mahoney John T | $170,000 | |
| Closed | Mahoney John T | $59,750 |
Source: Public Records
Tax History
| Year | Tax Paid | Tax Assessment Tax Assessment Total Assessment is a certain percentage of the fair market value that is determined by local assessors to be the total taxable value of land and additions on the property. | Land | Improvement |
|---|---|---|---|---|
| 2025 | $3,093 | $368,200 | $167,300 | $200,900 |
| 2024 | $4,819 | $262,600 | $91,800 | $170,800 |
| 2023 | $4,819 | $262,600 | $91,800 | $170,800 |
| 2022 | $4,674 | $262,600 | $91,800 | $170,800 |
| 2021 | $3,851 | $156,800 | $49,000 | $107,800 |
| 2020 | $3,851 | $156,800 | $49,000 | $107,800 |
| 2019 | $3,851 | $156,800 | $49,000 | $107,800 |
| 2018 | $3,912 | $122,400 | $41,600 | $80,800 |
| 2017 | $3,912 | $122,400 | $41,600 | $80,800 |
| 2016 | $3,912 | $122,400 | $41,600 | $80,800 |
| 2015 | $3,737 | $112,900 | $41,600 | $71,300 |
| 2014 | $3,810 | $112,900 | $41,600 | $71,300 |
| 2013 | $3,810 | $112,900 | $41,600 | $71,300 |
Source: Public Records
Map
Nearby Homes
- 31 Joseph St
- 1039 Douglas Ave
- 1166 Douglas Ave
- 115 Hazael St
- 135 Seamans St Unit 2
- 25 Hymer St
- 507 Sharon St
- 23 Concannon St
- 835 River Ave
- 22 Oneil St
- 873 Douglas Ave
- 876 Douglas Ave
- 871 Douglas Ave
- 860 Douglas Ave
- 39 Hillview Ave
- 272 Veazie St
- 17 Tremont St
- 73 Wainwright St
- 0 Wainwright St
- 160 Cumberland St
Your Personal Tour Guide
Ask me questions while you tour the home.