
Seller's Agent in 2021
Steve Maguire
EXP Realty
(603) 819-8690
1 in this area
36 Total Sales

Estimated Value: $379,000 - $387,000
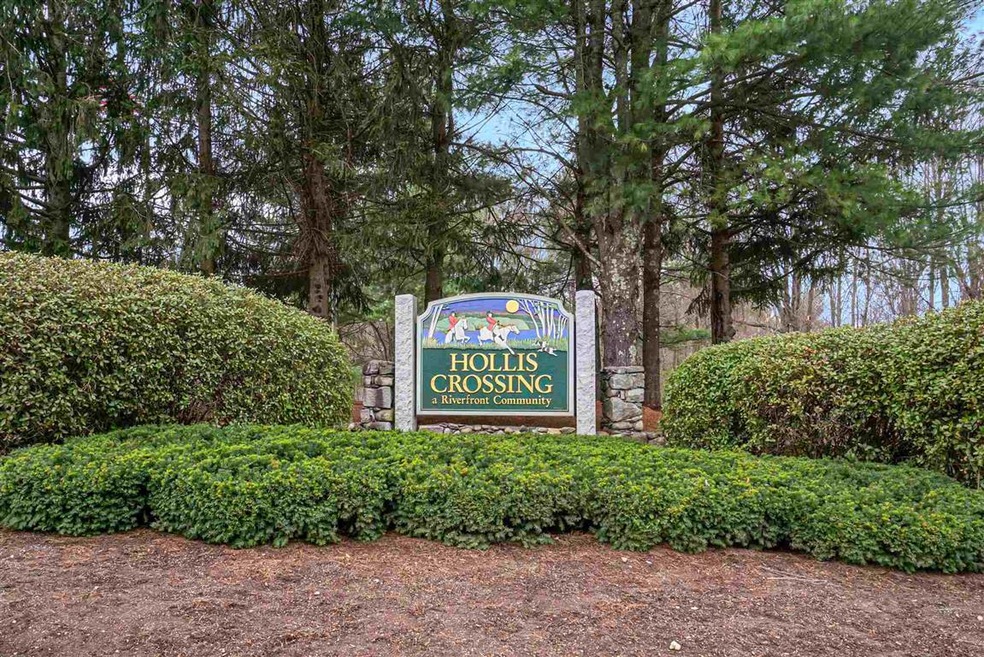
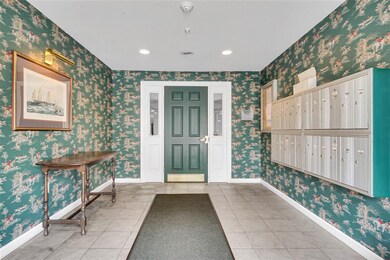
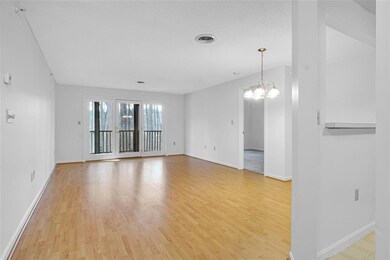
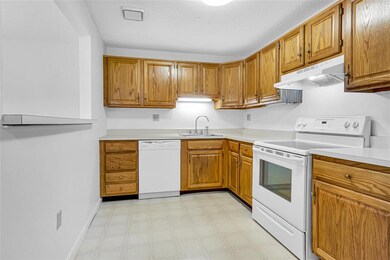
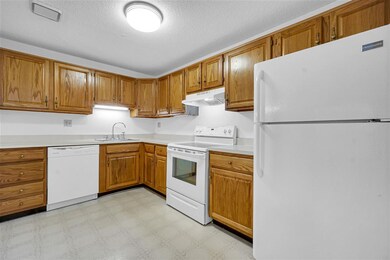
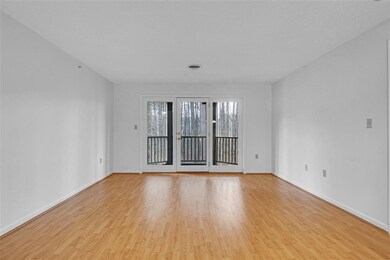
Welcome to Hollis Crossing! This 2nd Floor 2 Bedroom condo is all ready for you to move right in. Easy access with the elevator right down the hallway. This home has been freshly painted and cleaned! So many activities for you to enjoy year round and you can even bring your kayak! Showings begin 04/10/2021 at the open house (12p-2p).
| Date | Buyer | Sale Price | Title Company |
|---|---|---|---|
| Salibian Shoushan M | $110,000 | -- |
| Date | Event | Price | List to Sale | Price per Sq Ft |
|---|---|---|---|---|
| 05/26/2021 05/26/21 | Sold | $265,000 | +2.0% | $214 / Sq Ft |
| 04/12/2021 04/12/21 | Pending | -- | -- | -- |
| 04/06/2021 04/06/21 | For Sale | $259,900 | -- | $210 / Sq Ft |
| Year | Tax Paid | Tax Assessment Tax Assessment Total Assessment is a certain percentage of the fair market value that is determined by local assessors to be the total taxable value of land and additions on the property. | Land | Improvement |
|---|---|---|---|---|
| 2024 | $5,312 | $334,100 | $0 | $334,100 |
| 2023 | $5,002 | $274,400 | $0 | $274,400 |
| 2022 | $4,958 | $274,400 | $0 | $274,400 |
| 2021 | $4,024 | $173,300 | $0 | $173,300 |
| 2020 | $3,918 | $173,300 | $0 | $173,300 |
| 2019 | $3,771 | $173,300 | $0 | $173,300 |
| 2018 | $3,676 | $173,300 | $0 | $173,300 |
| 2017 | $3,286 | $127,400 | $0 | $127,400 |
| 2016 | $3,194 | $127,400 | $0 | $127,400 |
| 2015 | $3,125 | $127,400 | $0 | $127,400 |
| 2014 | $3,064 | $127,400 | $0 | $127,400 |
Seller's Agent in 2021
Steve Maguire
EXP Realty
(603) 819-8690
1 in this area
36 Total Sales
H
Buyer's Agent in 2021
Heather Johnson
Unique Realty LLC
(603) 748-1037
1 in this area
33 Total Sales
Source: PrimeMLS
MLS Number: 4854238
APN: NASH-000000-000004-000203-000009F
Disclaimer: Certain information contained herein is derived from information provided by parties other than Homes.com. All information provided is deemed reliable, but is not guaranteed to be accurate and should be independently verified.
![]() Copyright 2025 PrimeMLS, Inc. All rights reserved. This information is deemed reliable, but not guaranteed. The data relating to real estate displayed on this display comes in part from the IDX Program of PrimeMLS. The information being provided is for consumers’ personal, non-commercial use and may not be used for any purpose other than to identify prospective properties consumers may be interested in purchasing.
Copyright 2025 PrimeMLS, Inc. All rights reserved. This information is deemed reliable, but not guaranteed. The data relating to real estate displayed on this display comes in part from the IDX Program of PrimeMLS. The information being provided is for consumers’ personal, non-commercial use and may not be used for any purpose other than to identify prospective properties consumers may be interested in purchasing.