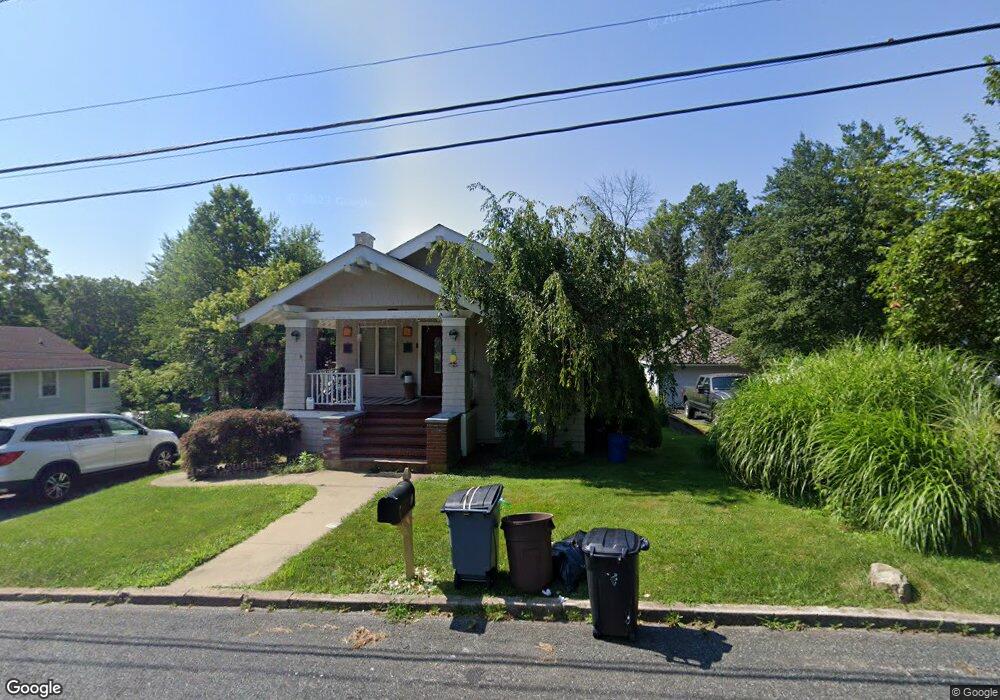
9 Beavers St Unit 1 High Bridge, NJ 08829
Estimated Value: $456,000 - $519,000
1
Bed
1
Bath
984
Sq Ft
$496/Sq Ft
Est. Value
About This Home
This home is located at 9 Beavers St Unit 1, High Bridge, NJ 08829 and is currently estimated at $487,648, approximately $495 per square foot. 9 Beavers St Unit 1 is a home located in Hunterdon County with nearby schools including High Bridge Elementary School, High Bridge Middle School, and Voorhees High School.
Ownership History
Date
Name
Owned For
Owner Type
Purchase Details
Closed on
Dec 6, 2024
Sold by
Veliz Ervin A and Ortiz Nelsy
Bought by
360 Investments Llc
Current Estimated Value
Home Financials for this Owner
Home Financials are based on the most recent Mortgage that was taken out on this home.
Original Mortgage
$326,400
Outstanding Balance
$323,858
Interest Rate
6.84%
Mortgage Type
New Conventional
Estimated Equity
$163,790
Purchase Details
Closed on
Jul 16, 2019
Sold by
Richardson Jonathan and Richardson Cheverly
Bought by
Veliz Ervin A
Home Financials for this Owner
Home Financials are based on the most recent Mortgage that was taken out on this home.
Original Mortgage
$265,000
Interest Rate
3.7%
Mortgage Type
Seller Take Back
Purchase Details
Closed on
Aug 26, 1994
Sold by
Martino Kenneth and Martino Christine
Bought by
Richardson Jonathan and Richardson Cheverly
Create a Home Valuation Report for This Property
The Home Valuation Report is an in-depth analysis detailing your home's value as well as a comparison with similar homes in the area
Home Values in the Area
Average Home Value in this Area
Purchase History
| Date | Buyer | Sale Price | Title Company |
|---|---|---|---|
| 360 Investments Llc | $408,000 | Wfg National Title | |
| 360 Investments Llc | $408,000 | Wfg National Title | |
| Veliz Ervin A | $275,000 | Pls Title & Settlement | |
| Richardson Jonathan | $132,500 | -- |
Source: Public Records
Mortgage History
| Date | Status | Borrower | Loan Amount |
|---|---|---|---|
| Open | 360 Investments Llc | $326,400 | |
| Closed | 360 Investments Llc | $326,400 | |
| Previous Owner | Veliz Ervin A | $265,000 |
Source: Public Records
Tax History Compared to Growth
Tax History
| Year | Tax Paid | Tax Assessment Tax Assessment Total Assessment is a certain percentage of the fair market value that is determined by local assessors to be the total taxable value of land and additions on the property. | Land | Improvement |
|---|---|---|---|---|
| 2025 | $10,007 | $301,000 | $102,600 | $198,400 |
| 2024 | $10,984 | $306,600 | $145,800 | $160,800 |
| 2023 | $10,984 | $277,800 | $110,100 | $167,700 |
| 2022 | $11,216 | $263,600 | $96,700 | $166,900 |
| 2021 | $8,820 | $263,000 | $96,700 | $166,300 |
| 2020 | $8,754 | $213,500 | $97,100 | $116,400 |
| 2019 | $8,683 | $210,200 | $97,100 | $113,100 |
| 2018 | $8,227 | $207,600 | $94,500 | $113,100 |
| 2017 | $8,498 | $220,500 | $103,500 | $117,000 |
| 2016 | $8,399 | $220,500 | $103,500 | $117,000 |
| 2015 | $8,172 | $220,500 | $103,500 | $117,000 |
| 2014 | $8,500 | $247,900 | $137,900 | $110,000 |
Source: Public Records
Map
Nearby Homes