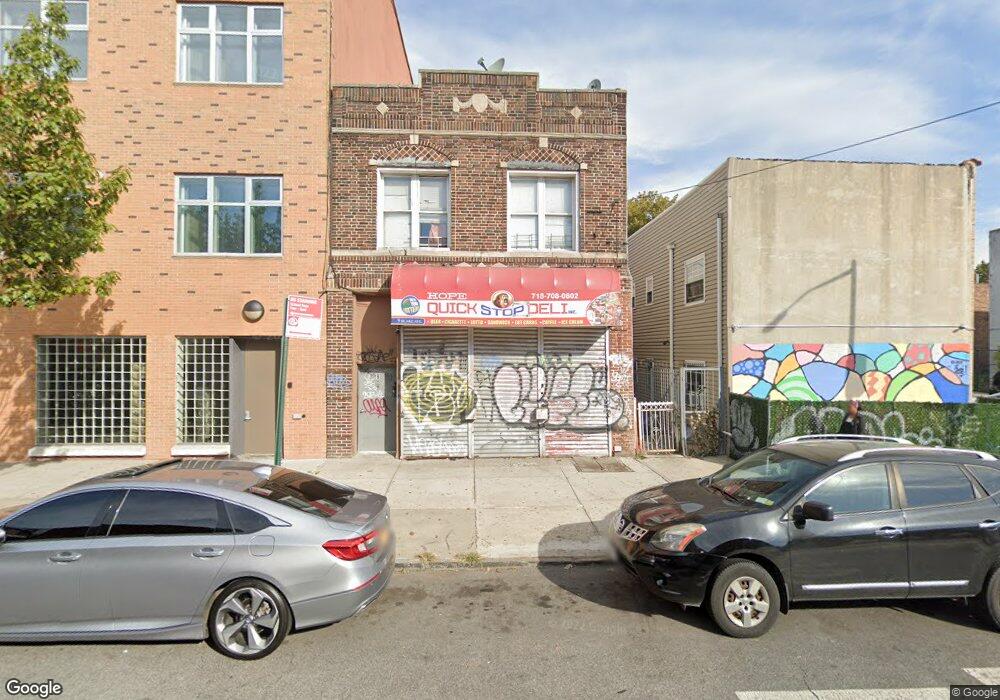
9 Blake Ave Brooklyn, NY 11212
Brownsville NeighborhoodEstimated Value: $772,361
Studio
--
Bath
3,192
Sq Ft
$242/Sq Ft
Est. Value
About This Home
This home is located at 9 Blake Ave, Brooklyn, NY 11212 and is currently estimated at $772,361, approximately $241 per square foot. 9 Blake Ave is a home located in Kings County with nearby schools including P.S. 189 Lincoln Terrace, New Heights Middle School, and Brooklyn Ascend Charter School.
Ownership History
Date
Name
Owned For
Owner Type
Purchase Details
Closed on
Dec 9, 2022
Sold by
Hill Shirley and Hill Winston
Bought by
Hill Winston A
Current Estimated Value
Purchase Details
Closed on
May 5, 2006
Sold by
Clark Julie A
Bought by
Hill Shirley and Hill Winston
Purchase Details
Closed on
Oct 16, 2001
Sold by
Mitchell Carolyn O
Bought by
Peace Gregory
Home Financials for this Owner
Home Financials are based on the most recent Mortgage that was taken out on this home.
Original Mortgage
$235,000
Outstanding Balance
$88,684
Interest Rate
6.7%
Mortgage Type
Commercial
Estimated Equity
$689,751
Purchase Details
Closed on
Aug 4, 1997
Sold by
Bettis Catherine C
Bought by
Mitchell Carolyn O
Home Financials for this Owner
Home Financials are based on the most recent Mortgage that was taken out on this home.
Original Mortgage
$171,000
Interest Rate
7.41%
Mortgage Type
FHA
Create a Home Valuation Report for This Property
The Home Valuation Report is an in-depth analysis detailing your home's value as well as a comparison with similar homes in the area
Home Values in the Area
Average Home Value in this Area
Purchase History
| Date | Buyer | Sale Price | Title Company |
|---|---|---|---|
| Hill Winston A | -- | -- | |
| Hill Winston A | -- | -- | |
| Hill Winston A | -- | -- | |
| Hill Shirley | -- | -- | |
| Hill Shirley | -- | -- | |
| Peace Gregory | -- | -- | |
| Peace Gregory | -- | -- | |
| Mitchell Carolyn O | $138,000 | Commonwealth Land Title Ins | |
| Mitchell Carolyn O | $138,000 | Commonwealth Land Title Ins |
Source: Public Records
Mortgage History
| Date | Status | Borrower | Loan Amount |
|---|---|---|---|
| Open | Peace Gregory | $235,000 | |
| Closed | Peace Gregory | $235,000 | |
| Previous Owner | Mitchell Carolyn O | $171,000 |
Source: Public Records
Tax History
| Year | Tax Paid | Tax Assessment Tax Assessment Total Assessment is a certain percentage of the fair market value that is determined by local assessors to be the total taxable value of land and additions on the property. | Land | Improvement |
|---|---|---|---|---|
| 2025 | $3,332 | $53,100 | $10,380 | $42,720 |
| 2024 | $3,332 | $48,840 | $10,380 | $38,460 |
| 2023 | $3,179 | $50,460 | $10,380 | $40,080 |
| 2022 | $2,954 | $45,000 | $10,380 | $34,620 |
| 2021 | $2,940 | $40,260 | $10,380 | $29,880 |
| 2020 | $1,462 | $42,300 | $10,380 | $31,920 |
| 2019 | $2,892 | $39,300 | $10,380 | $28,920 |
| 2018 | $2,659 | $13,046 | $4,134 | $8,912 |
| 2017 | $2,513 | $12,330 | $4,191 | $8,139 |
| 2016 | $2,328 | $11,643 | $4,417 | $7,226 |
| 2015 | $1,403 | $11,643 | $5,301 | $6,342 |
| 2014 | $1,403 | $11,520 | $6,021 | $5,499 |
Source: Public Records
Map
Nearby Homes
- 2127 Union St
- 136 Rockaway Pkwy
- 99 E 96th St
- 170 E 96th St
- 211 E 96th St Unit 4
- 202 E 96th St
- 1102 Winthrop St Unit 4
- 31 Tapscott St
- 244 Grafton St
- 189 Legion St
- 121 Legion St
- 83 Dumont Ave
- 637 Saratoga Ave
- 286 Rockaway Pkwy
- 687 Saratoga Ave
- 267 Legion St
- 131 E 93rd St Unit 4
- 994 Rutland Rd
- 589 Saratoga Ave
- 1973 Strauss St
- 2140 Union St
- 2130 Union St
- 2130 Union St Unit 1
- 5 Blake Ave
- 2126 Union St
- 1 Blake Ave
- 2124 Union St
- 2122 Union St
- 2118 Union St
- 19 Blake Ave Unit 1A
- 15 Blake Ave
- 149 E 98th St
- 2125 Union St
- 741-757 Ralph Ave
- 2121 Union St
- 745 Ralph Ave Unit A
- 2119 Union St
- 2106-2110 Union St
- 2115 Union St
- 2106 Union St Unit 4 d
Your Personal Tour Guide
Ask me questions while you tour the home.