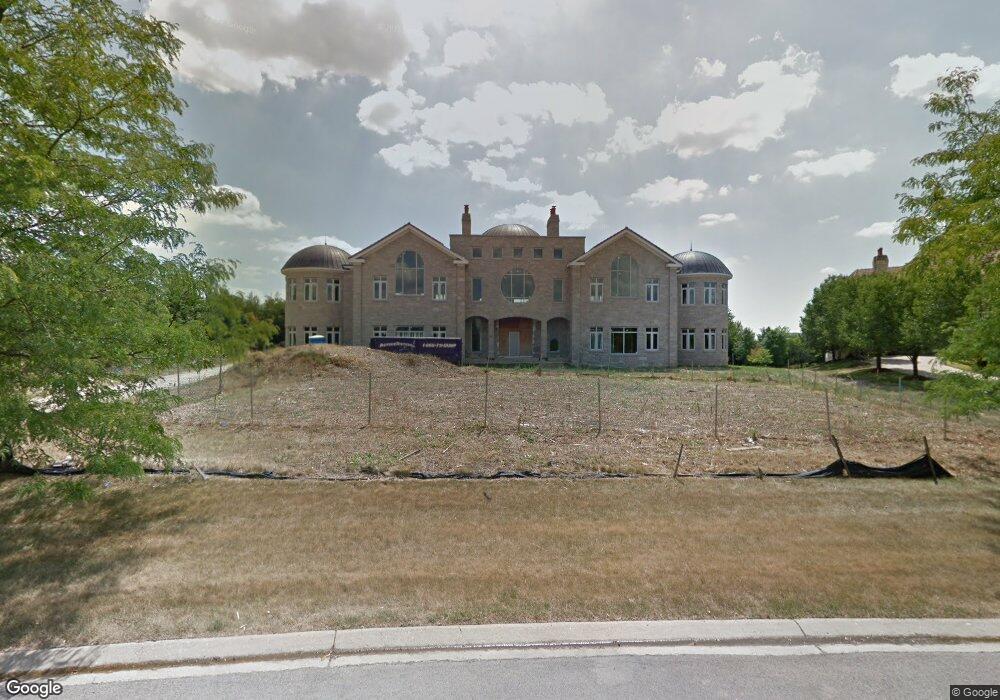
9 Blossom Ct South Barrington, IL 60010
Estimated Value: $2,791,729 - $4,728,000
6
Beds
10
Baths
14,295
Sq Ft
$251/Sq Ft
Est. Value
About This Home
This home is located at 9 Blossom Ct, South Barrington, IL 60010 and is currently estimated at $3,584,576, approximately $250 per square foot. 9 Blossom Ct is a home located in Cook County with nearby schools including Barbara B. Rose Elementary School, Barrington Mdle School- Prairie Cmps, and Barrington High School.
Ownership History
Date
Name
Owned For
Owner Type
Purchase Details
Closed on
Aug 26, 2014
Sold by
Manhood Imran and Imran Mehnaz
Bought by
Chicago Title Land Trust Company and Trust #8002365753
Current Estimated Value
Purchase Details
Closed on
Dec 30, 2011
Sold by
Biesterfield Partners Llc
Bought by
Mahmood Imran
Home Financials for this Owner
Home Financials are based on the most recent Mortgage that was taken out on this home.
Original Mortgage
$570,000
Interest Rate
3.97%
Mortgage Type
Seller Take Back
Purchase Details
Closed on
Feb 7, 2003
Sold by
Parkway Bank & Trust Co
Bought by
Arthur Chad and Arthur Anna Marie
Home Financials for this Owner
Home Financials are based on the most recent Mortgage that was taken out on this home.
Original Mortgage
$290,000
Interest Rate
4.25%
Create a Home Valuation Report for This Property
The Home Valuation Report is an in-depth analysis detailing your home's value as well as a comparison with similar homes in the area
Home Values in the Area
Average Home Value in this Area
Purchase History
| Date | Buyer | Sale Price | Title Company |
|---|---|---|---|
| Chicago Title Land Trust Company | -- | None Available | |
| Mahmood Imran | $1,470,000 | Cti | |
| Arthur Chad | $290,000 | Cti |
Source: Public Records
Mortgage History
| Date | Status | Borrower | Loan Amount |
|---|---|---|---|
| Previous Owner | Mahmood Imran | $570,000 | |
| Previous Owner | Arthur Chad | $290,000 |
Source: Public Records
Tax History Compared to Growth
Tax History
| Year | Tax Paid | Tax Assessment Tax Assessment Total Assessment is a certain percentage of the fair market value that is determined by local assessors to be the total taxable value of land and additions on the property. | Land | Improvement |
|---|---|---|---|---|
| 2024 | $41,100 | $184,658 | $24,561 | $160,097 |
| 2023 | $43,810 | $184,658 | $24,561 | $160,097 |
| 2022 | $43,810 | $202,258 | $24,561 | $177,697 |
| 2021 | $43,328 | $177,495 | $18,420 | $159,075 |
| 2020 | $42,003 | $177,495 | $18,420 | $159,075 |
| 2019 | $43,072 | $206,970 | $18,420 | $188,550 |
| 2018 | $53,207 | $247,768 | $16,885 | $230,883 |
| 2017 | $51,792 | $247,768 | $16,885 | $230,883 |
| 2016 | $56,339 | $282,001 | $16,885 | $265,116 |
| 2015 | $20,611 | $95,417 | $15,350 | $80,067 |
| 2014 | $9,077 | $42,263 | $15,350 | $26,913 |
| 2013 | $5,910 | $28,806 | $15,350 | $13,456 |
Source: Public Records
Map
Nearby Homes