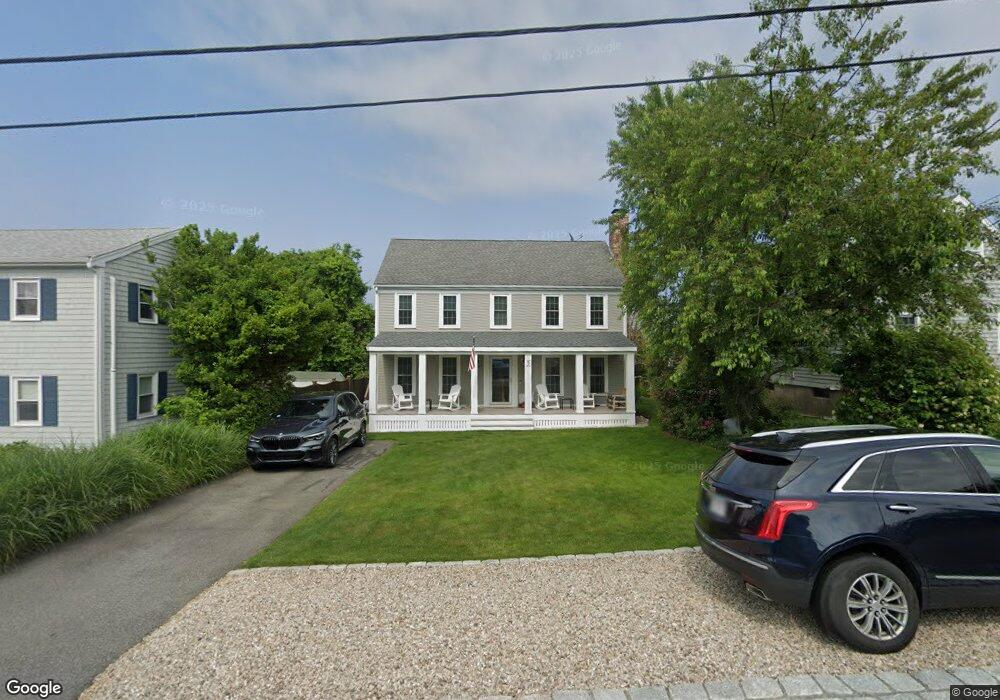
9 Bodfish Ave Sandwich, MA 02563
Estimated Value: $824,948 - $920,000
3
Beds
2
Baths
1,768
Sq Ft
$494/Sq Ft
Est. Value
About This Home
This home is located at 9 Bodfish Ave, Sandwich, MA 02563 and is currently estimated at $874,237, approximately $494 per square foot. 9 Bodfish Ave is a home located in Barnstable County with nearby schools including Sandwich Middle High School, Waldorf School of Cape Cod, and Bridgeview Montessori School.
Ownership History
Date
Name
Owned For
Owner Type
Purchase Details
Closed on
Aug 21, 2009
Sold by
9 Bodfish Avenue Rt
Bought by
Sherman Robert S and Sherman Jana L
Current Estimated Value
Home Financials for this Owner
Home Financials are based on the most recent Mortgage that was taken out on this home.
Original Mortgage
$200,000
Outstanding Balance
$130,268
Interest Rate
5.19%
Mortgage Type
Purchase Money Mortgage
Estimated Equity
$743,969
Purchase Details
Closed on
Apr 30, 2002
Sold by
Stoddard Ray E and Harris Rita M
Bought by
Campbell Andrew D and Doane Linda J
Home Financials for this Owner
Home Financials are based on the most recent Mortgage that was taken out on this home.
Original Mortgage
$250,000
Interest Rate
7.05%
Mortgage Type
Purchase Money Mortgage
Purchase Details
Closed on
Jun 10, 1999
Sold by
Hughes David J
Bought by
Stoddard Ray E and Harris Rita M
Home Financials for this Owner
Home Financials are based on the most recent Mortgage that was taken out on this home.
Original Mortgage
$144,000
Interest Rate
6.9%
Mortgage Type
Purchase Money Mortgage
Purchase Details
Closed on
Dec 3, 1998
Sold by
Fitzgerald William M and Fitzgerald Lexina M
Bought by
Hughes David J
Home Financials for this Owner
Home Financials are based on the most recent Mortgage that was taken out on this home.
Original Mortgage
$125,000
Interest Rate
6.68%
Mortgage Type
Purchase Money Mortgage
Create a Home Valuation Report for This Property
The Home Valuation Report is an in-depth analysis detailing your home's value as well as a comparison with similar homes in the area
Home Values in the Area
Average Home Value in this Area
Purchase History
| Date | Buyer | Sale Price | Title Company |
|---|---|---|---|
| Sherman Robert S | $362,500 | -- | |
| Campbell Andrew D | $312,500 | -- | |
| Stoddard Ray E | $180,000 | -- | |
| Hughes David J | $35,000 | -- |
Source: Public Records
Mortgage History
| Date | Status | Borrower | Loan Amount |
|---|---|---|---|
| Open | Sherman Robert S | $200,000 | |
| Previous Owner | Campbell Andrew D | $250,000 | |
| Previous Owner | Stoddard Ray E | $144,000 | |
| Previous Owner | Hughes David J | $125,000 |
Source: Public Records
Tax History Compared to Growth
Tax History
| Year | Tax Paid | Tax Assessment Tax Assessment Total Assessment is a certain percentage of the fair market value that is determined by local assessors to be the total taxable value of land and additions on the property. | Land | Improvement |
|---|---|---|---|---|
| 2025 | $7,675 | $726,100 | $350,400 | $375,700 |
| 2024 | $7,028 | $650,700 | $291,900 | $358,800 |
| 2023 | $6,849 | $595,600 | $265,300 | $330,300 |
| 2022 | $6,092 | $462,900 | $213,200 | $249,700 |
| 2021 | $5,877 | $426,800 | $205,000 | $221,800 |
| 2020 | $5,727 | $400,200 | $187,200 | $213,000 |
| 2019 | $5,463 | $381,500 | $182,000 | $199,500 |
| 2018 | $5,044 | $353,000 | $165,200 | $187,800 |
| 2017 | $4,900 | $328,200 | $153,100 | $175,100 |
| 2016 | $4,691 | $324,200 | $151,500 | $172,700 |
| 2015 | $4,618 | $311,600 | $142,600 | $169,000 |
Source: Public Records
Map
Nearby Homes