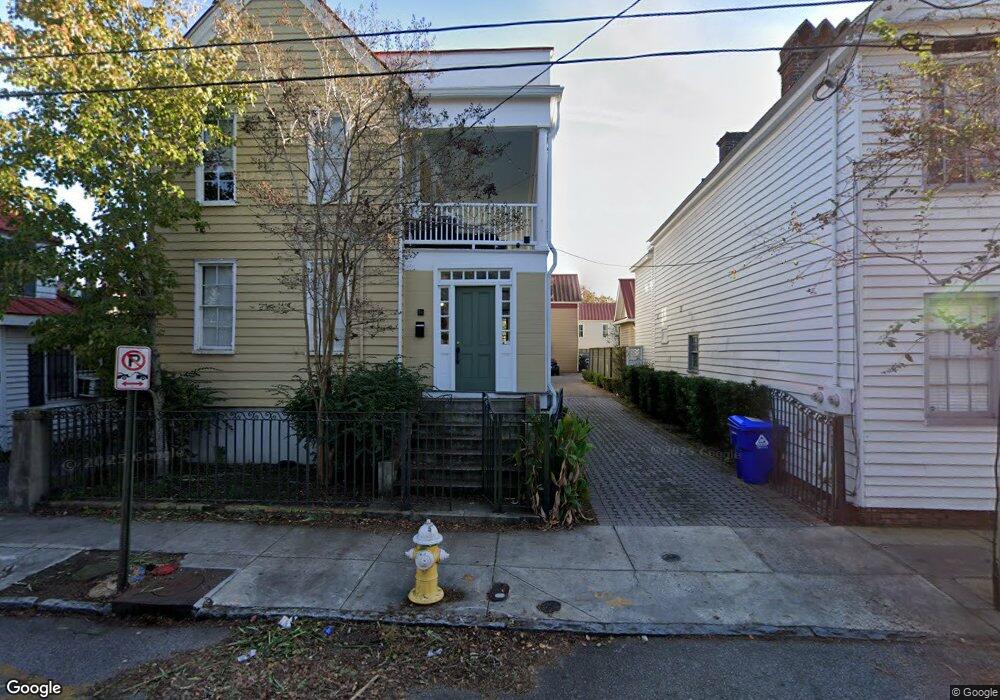
9 Bogard St Unit 1 Charleston, SC 29403
Cannonborough-Elliotborough NeighborhoodEstimated Value: $841,000 - $1,005,047
3
Beds
2
Baths
1,742
Sq Ft
$536/Sq Ft
Est. Value
About This Home
This home is located at 9 Bogard St Unit 1, Charleston, SC 29403 and is currently estimated at $934,012, approximately $536 per square foot. 9 Bogard St Unit 1 is a home located in Charleston County with nearby schools including Mitchell Elementary School, James Simons Elementary School, and Simmons Pinckney Middle.
Ownership History
Date
Name
Owned For
Owner Type
Purchase Details
Closed on
Nov 29, 2021
Sold by
Rigtrup Kathleen D
Bought by
Edward D Rigtrup And Kathleen D Rigtrup Livin
Current Estimated Value
Purchase Details
Closed on
Jul 19, 2021
Sold by
John J Laporta Revocable Trust
Bought by
Kovinkov Anatoliy E and Kovinkov Nathalie K
Home Financials for this Owner
Home Financials are based on the most recent Mortgage that was taken out on this home.
Original Mortgage
$472,000
Interest Rate
2.8%
Mortgage Type
New Conventional
Purchase Details
Closed on
Mar 2, 2020
Sold by
Laporta John J
Bought by
Laporta John J and Laporta Sherrie L
Purchase Details
Closed on
Jan 13, 2015
Sold by
Laporta Cassie Ann
Bought by
Laporta John J
Purchase Details
Closed on
Nov 18, 2008
Sold by
Laporta John J
Bought by
Laporta Cassie Ann
Purchase Details
Closed on
Apr 24, 2006
Sold by
Feaver Jonathan C and Shelenberger Fred E
Bought by
Laporta John J
Purchase Details
Closed on
Dec 8, 2004
Sold by
Yellow Dog Design & Development Llc
Bought by
Feaver Jonathan C and Shelenberger Fred E
Create a Home Valuation Report for This Property
The Home Valuation Report is an in-depth analysis detailing your home's value as well as a comparison with similar homes in the area
Home Values in the Area
Average Home Value in this Area
Purchase History
| Date | Buyer | Sale Price | Title Company |
|---|---|---|---|
| Edward D Rigtrup And Kathleen D Rigtrup Livin | -- | None Listed On Document | |
| Kovinkov Anatoliy E | $590,000 | None Listed On Document | |
| Laporta John J | -- | None Available | |
| Laporta John J | -- | -- | |
| Laporta Cassie Ann | -- | -- | |
| Laporta John J | $484,500 | None Available | |
| Feaver Jonathan C | $360,000 | -- |
Source: Public Records
Mortgage History
| Date | Status | Borrower | Loan Amount |
|---|---|---|---|
| Previous Owner | Kovinkov Anatoliy E | $472,000 |
Source: Public Records
Tax History Compared to Growth
Tax History
| Year | Tax Paid | Tax Assessment Tax Assessment Total Assessment is a certain percentage of the fair market value that is determined by local assessors to be the total taxable value of land and additions on the property. | Land | Improvement |
|---|---|---|---|---|
| 2024 | $10,189 | $35,400 | $0 | $0 |
| 2023 | $10,189 | $35,400 | $0 | $0 |
| 2022 | $9,447 | $35,400 | $0 | $0 |
| 2021 | $6,944 | $26,250 | $0 | $0 |
| 2020 | $6,893 | $26,250 | $0 | $0 |
| 2019 | $6,300 | $22,830 | $0 | $0 |
| 2017 | $6,018 | $22,830 | $0 | $0 |
| 2016 | $5,822 | $22,830 | $0 | $0 |
| 2015 | $5,558 | $22,830 | $0 | $0 |
| 2014 | $1,795 | $0 | $0 | $0 |
| 2011 | -- | $0 | $0 | $0 |
Source: Public Records
Map
Nearby Homes
- 9 Bogard St Unit 6 (F)
- 4 Bogard St
- 11 McHughes Alley
- 207 St Philip St
- 609 King St Unit 603
- 609 King St Unit 515
- 609 King St Unit 416
- 609 King St Unit 740
- 609 King St Unit 615
- 609 King St Unit Gf3
- 609 King St Unit 715
- 609 King St Unit 732
- 609 King St Unit 348
- 609 King St Unit 701
- 609 King St Unit 335
- 609 King St Unit 448
- 609 King St Unit 730
- 609 King St Unit 349
- 609 King St Unit 331
- 609 King St Unit 608
- 9 Bogard St Unit 7
- 9 Bogard St
- 9 Bogard St Unit 5
- 9 Bogard St Unit 4
- 9 Bogard St Unit 3
- 9 Bogard St Unit 2
- 9 Bogard St Unit 8
- 9 Bogard St Unit 9g
- 9 Bogard St Unit 4
- 9 Bogard St Unit 6
- 9 Bogard St Unit G
- 9 Bogard St Unit H
- 9 Bogard St Unit C
- 9 Bogard St Unit D
- 9 Bogard St Unit F
- 9 Bogard St Unit B
- 9 Bogard St Unit 7
- 9 Bogard St Unit 8
- 9 Bogard St Unit 5
- 9 Bogard St Unit 9E