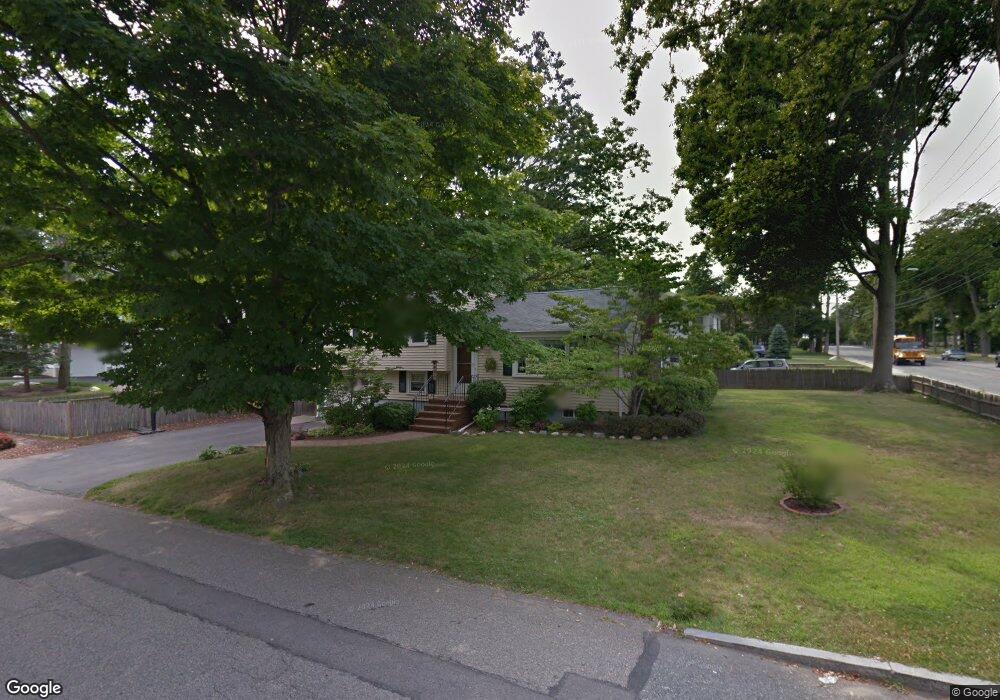
9 Bonney St Westwood, MA 02090
Estimated Value: $735,493 - $815,000
3
Beds
2
Baths
1,380
Sq Ft
$562/Sq Ft
Est. Value
About This Home
This home is located at 9 Bonney St, Westwood, MA 02090 and is currently estimated at $776,123, approximately $562 per square foot. 9 Bonney St is a home located in Norfolk County with nearby schools including Westwood High School, St Catherine Of Siena School, and Xaverian Brothers High School.
Ownership History
Date
Name
Owned For
Owner Type
Purchase Details
Closed on
Aug 18, 2008
Sold by
Bruno Mary B and Bruno Philip G
Bought by
Sullivan Andrew M and Kay Laura R
Current Estimated Value
Home Financials for this Owner
Home Financials are based on the most recent Mortgage that was taken out on this home.
Original Mortgage
$412,406
Outstanding Balance
$271,602
Interest Rate
6.4%
Mortgage Type
Purchase Money Mortgage
Estimated Equity
$504,521
Create a Home Valuation Report for This Property
The Home Valuation Report is an in-depth analysis detailing your home's value as well as a comparison with similar homes in the area
Home Values in the Area
Average Home Value in this Area
Purchase History
| Date | Buyer | Sale Price | Title Company |
|---|---|---|---|
| Sullivan Andrew M | $435,000 | -- |
Source: Public Records
Mortgage History
| Date | Status | Borrower | Loan Amount |
|---|---|---|---|
| Open | Sullivan Andrew M | $412,406 |
Source: Public Records
Tax History Compared to Growth
Tax History
| Year | Tax Paid | Tax Assessment Tax Assessment Total Assessment is a certain percentage of the fair market value that is determined by local assessors to be the total taxable value of land and additions on the property. | Land | Improvement |
|---|---|---|---|---|
| 2025 | $8,539 | $667,100 | $427,700 | $239,400 |
| 2024 | $8,096 | $632,000 | $407,300 | $224,700 |
| 2023 | $7,383 | $516,300 | $339,400 | $176,900 |
| 2022 | $6,797 | $458,350 | $300,050 | $158,300 |
| 2021 | $6,887 | $466,000 | $285,850 | $180,150 |
| 2020 | $6,762 | $466,000 | $285,850 | $180,150 |
| 2019 | $7,042 | $480,650 | $272,150 | $208,500 |
| 2018 | $6,665 | $441,700 | $272,150 | $169,550 |
| 2017 | $6,317 | $433,550 | $272,150 | $161,400 |
| 2016 | $6,264 | $427,300 | $272,150 | $155,150 |
| 2015 | $6,432 | $422,050 | $272,150 | $149,900 |
Source: Public Records
Map
Nearby Homes
- 49 Fisher St
- 48 Lakeshore Dr
- 131 Bay Colony Dr
- 618 Nahatan St
- 17 Royal Ct
- 60 Warwick Dr
- 66 Crestwood Cir
- 4 Shoestring Ln
- 401 Sandy Valley Rd
- 95 Arcadia Rd
- 36 Kingswood Rd
- 470 Nahatan St
- 39 Westbrook Ln
- 227 Prospect St
- 42 Myrtle St
- 85 Casey St
- 25 Bird Rd
- 140 Burgess Ave
- 365 Washington St Unit 4
- 60 Florence Ave Unit A