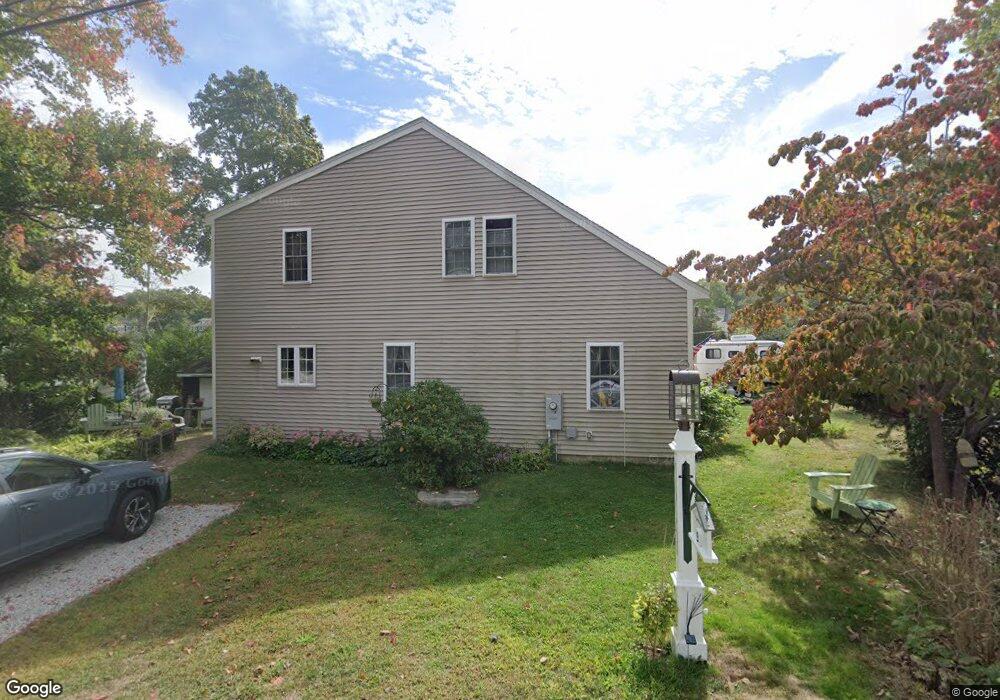
9 Bonnie Brier Cir Hingham, MA 02043
Estimated Value: $678,000 - $1,031,000
4
Beds
3
Baths
1,938
Sq Ft
$444/Sq Ft
Est. Value
About This Home
This home is located at 9 Bonnie Brier Cir, Hingham, MA 02043 and is currently estimated at $860,970, approximately $444 per square foot. 9 Bonnie Brier Cir is a home located in Plymouth County with nearby schools including East Elementary School, St. Paul Elementary School, and Derby Academy.
Ownership History
Date
Name
Owned For
Owner Type
Purchase Details
Closed on
Mar 15, 2024
Sold by
Pinkham Joseph L and Pinkham Karen A
Bought by
Pinkham Rt and Pinkham
Current Estimated Value
Purchase Details
Closed on
Oct 29, 1996
Sold by
Morrill V Erma Est and Morrill
Bought by
Pinkham Joseph L and Pinkham Karen A
Create a Home Valuation Report for This Property
The Home Valuation Report is an in-depth analysis detailing your home's value as well as a comparison with similar homes in the area
Home Values in the Area
Average Home Value in this Area
Purchase History
| Date | Buyer | Sale Price | Title Company |
|---|---|---|---|
| Pinkham Rt | -- | None Available | |
| Pinkham Rt | -- | None Available | |
| Pinkham Joseph L | $75,000 | -- | |
| Pinkham Joseph L | $75,000 | -- |
Source: Public Records
Mortgage History
| Date | Status | Borrower | Loan Amount |
|---|---|---|---|
| Previous Owner | Pinkham Joseph L | $15,000 | |
| Previous Owner | Pinkham Joseph L | $10,000 | |
| Previous Owner | Pinkham Joseph L | $165,000 |
Source: Public Records
Tax History Compared to Growth
Tax History
| Year | Tax Paid | Tax Assessment Tax Assessment Total Assessment is a certain percentage of the fair market value that is determined by local assessors to be the total taxable value of land and additions on the property. | Land | Improvement |
|---|---|---|---|---|
| 2025 | $6,322 | $591,400 | $254,500 | $336,900 |
| 2024 | $5,983 | $551,400 | $254,500 | $296,900 |
| 2023 | $5,113 | $511,300 | $254,500 | $256,800 |
| 2022 | $5,031 | $435,200 | $229,800 | $205,400 |
| 2021 | $4,845 | $407,500 | $229,800 | $177,700 |
| 2020 | $4,698 | $407,500 | $229,800 | $177,700 |
| 2019 | $0 | $392,100 | $229,800 | $162,300 |
| 2018 | $4,579 | $389,000 | $229,800 | $159,200 |
| 2017 | $4,181 | $341,300 | $182,400 | $158,900 |
| 2016 | $4,154 | $332,600 | $173,700 | $158,900 |
| 2015 | $4,389 | $350,300 | $165,500 | $184,800 |
Source: Public Records
Map
Nearby Homes
- 10 Chestnut Place
- 166 Hull St
- 321 Rockland St
- 6 Grace Dr
- 114 Hull St
- 1 Gatehouse Ln Unit 1
- 10 Ocean Ledge Dr
- 45 Ocean Ledge Dr
- LOT 1B Rockland St
- 23 Wyola Rd
- 20 Rockland House Rd Unit 203
- 22 Berkley Rd Unit B
- 22 Berkley Rd Unit C
- 121 Nantasket Ave Unit 503
- 54 Salisbury St Waterfront
- 4 Atherton Rd
- 6 State Park Rd Unit 2
- 25 Oceanside Dr
- 62 Oceanside Dr
- 101 Rockland St
- 5 Bonnie Brier Cir
- 72 Bonnie Brier Cir
- 67 Bonnie Brier Cir
- 15 Bonnie Brier Cir
- 70 Bonnie Brier Cir
- 10 Bonnie Brier Cir
- 8 Bonnie Brier Cir
- 12 Bonnie Brier Cir
- 6 Bonnie Brier Cir
- 3 Bonnie Brier Cir
- 68 Bonnie Brier Cir
- 17 Bonnie Brier Cir
- 14 Bonnie Brier Cir
- 63 Bonnie Brier Cir
- 19 Bonnie Brier Cir
- 16 Bonnie Brier Cir
- 64 Bonnie Brier Cir
- 59 Bonnie Brier Cir
- 25 Bonnie Brier Cir
- 20 Bonnie Brier Cir